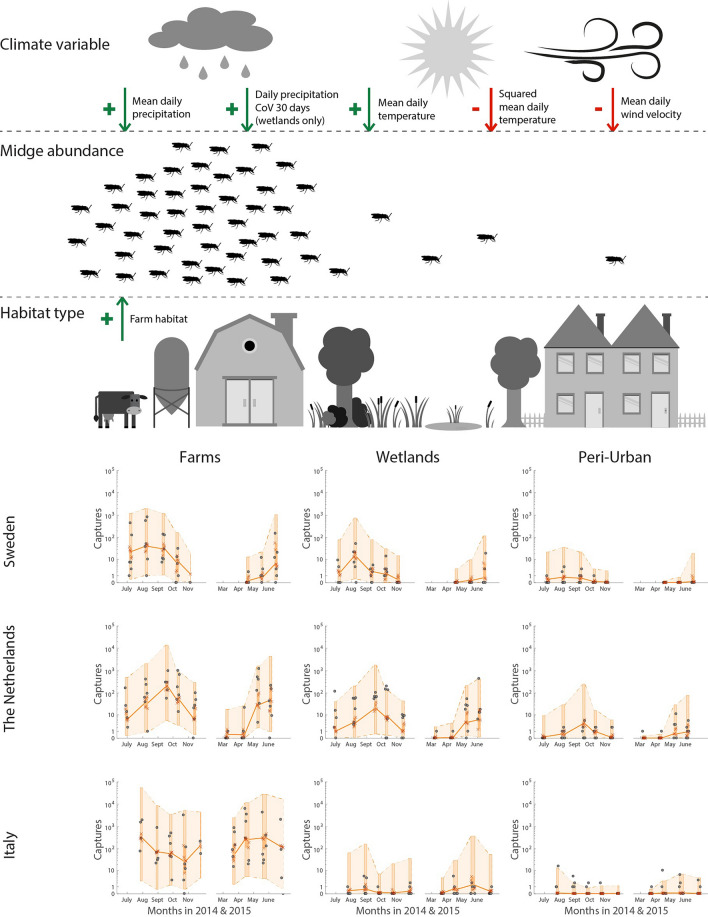
Figure 3.
Diagram for midge activity model (top) with midge catch counts and catch model predictions (bottom). Black circles show catch counts and orange crosses are the median prediction of the GLMM over all possible random effects, with orange lines connecting the median predictions of catch weeks. Background shading show GLMM catch predictions between 5 and 95% percentiles for random effect coefficients, with deeper shading indicating a collection week. Images created by Viola Visser.

