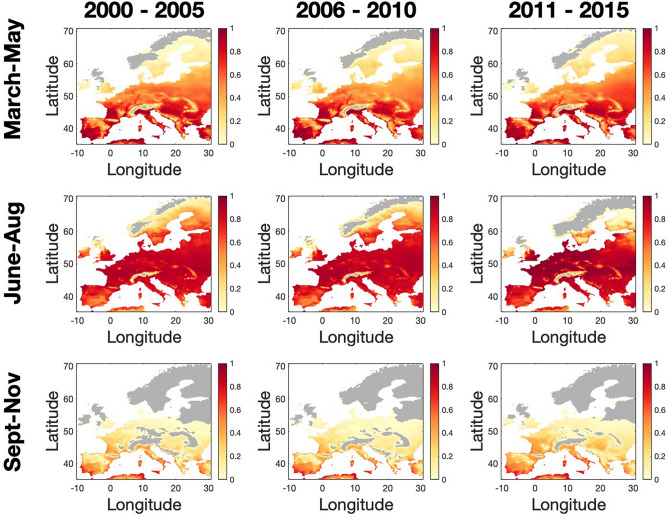
Figure 5.
Estimated proportion of naive herds at risk of BTV outbreaks (). Estimations over time periods of five years and early (March–May), mid (June–August) and late (September–November) seasons mapped across Europe for 2000–2015 (spatial cell scale = 0.25° lat./long.). Colours indicate increasing proportion of risk from yellow to red (zero risk is coloured grey). It should be noted that the risk map was calibrated using serological data for BTV-8 serotype and midge capture data that did not include C. imicola (see Results and Discussion).

