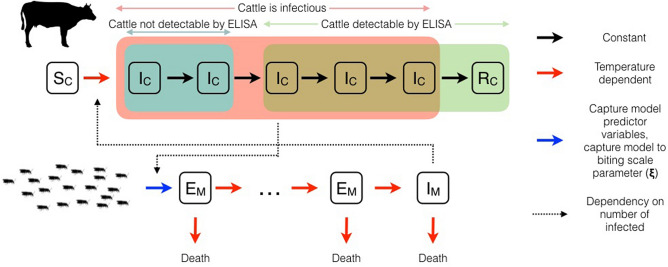
Figure 6.
Schematic representation of the cattle herd level BTV transmission model. The population of cattle and infected biting midges are divided amongst discrete disease compartments. BTV latent midges (EM) enter the model at a rate proportional to the daily prediction of the catch model. The extrinsic incubation period for latent midges is modelled as a multi-stage process before midges become infectious (IM). Susceptible cattle (SC) become infectious cattle (IC) after a bite from infectious midges (IM), to become resistant cattle (RC) in time (also modelled as a multi-stage process; red box). Transitions are shown as solid lines, coloured according to their dependence on environmental variables: constant per-capita (black), daily mean temperature dependent (red), all predictor variables of capture model and the catch-to-bite scale parameter (blue). Dotted lines indicate where the number of infected individuals in one species increases the incidence rate in the other species. Outcomes of the model are linked to observed cattle milk serology time series by the first two infectious stages for cattle with virus being undetectable by ELISA (blue box), whereas subsequent infectious stages and the recovered stage are detectable by ELISA (green box). The likelihood function for was inferred by marginalisation over the latent stochastic variables affecting model outcomes (e.g. herd-specific random effects, daily fluctuations in midge activity). Used images were available under open licence Creative Commons Deed CC0.

