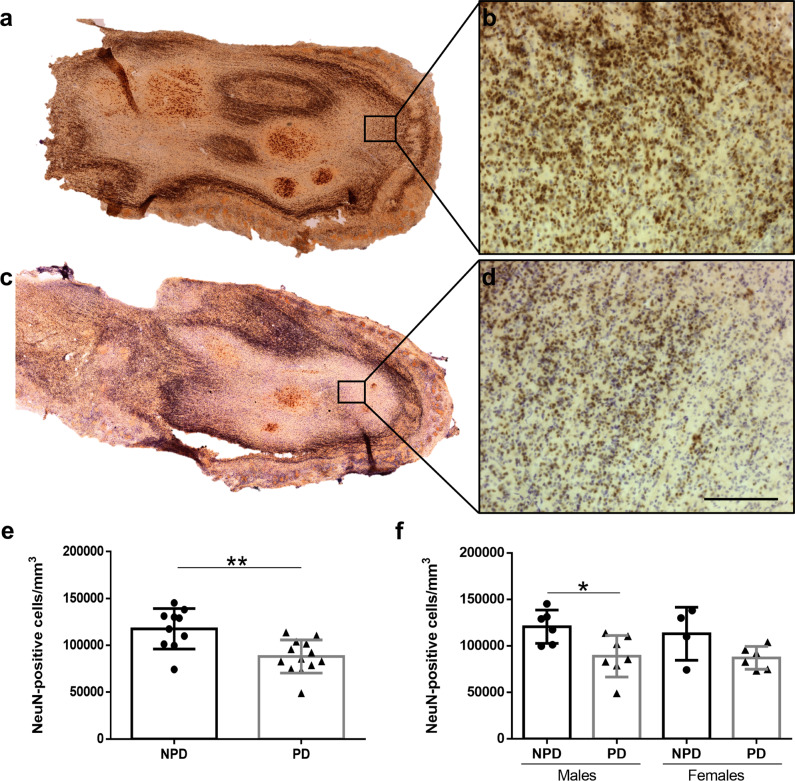
Fig. 3. Neurodegeneration.
Mosaic reconstruction of Neu-N-immunoreacted images of horizontal sections of the human olfactory bulb in non-Parkinson’s disease (a) and a Parkinson’s disease case (c) and the corresponding high-power details (b, d). Calibration bars, a, c 1000 µm; b, d 100 µm. Graphs (Mean ± SD) illustrating the density of Neu-N-positive cells in the Parkinson’s disease (PD) and non-Parkinson’s disease (NPD) groups (e) and including the sex of individuals (f).

