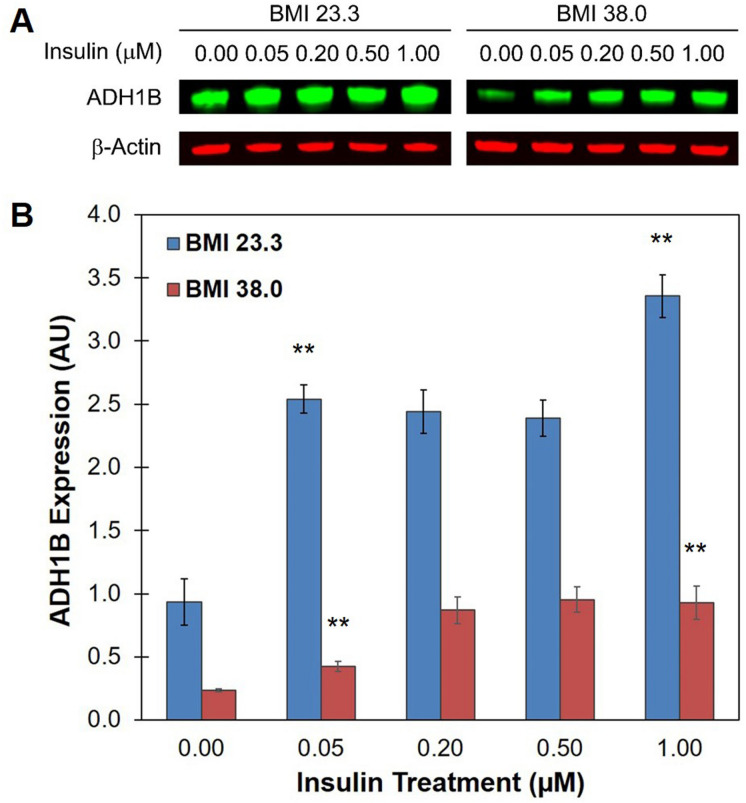
Figure 5.
Insulin promotes expression of ADH1B in lean and obese adipocytes. (A) Representative composite immunoblot image of cell lysates from lean (BMI < 28 kg m−2) and obese (BMI ≥ 30 kg m−2) adipocytes following treatment with increasing doses of insulin. Cells were starved for 12 h and then treated with the indicated dose of insulin for 1 h. Total protein was isolated, resolved by SDS-PAGE, and immunoblotted with antibodies specific for ADH1B and β-Actin loading control. Full length blot is presented in Supplementary Figure S14. (B) Quantitative analysis of ADH1B expression. Western blot analysis was performed in quadruplicate. Fluorescence intensity was quantified and normalized to β-Actin control. Data is presented as the mean ± s.e.m. AU, Arbitrary Units; **P < 0.001.

