Figure 6.
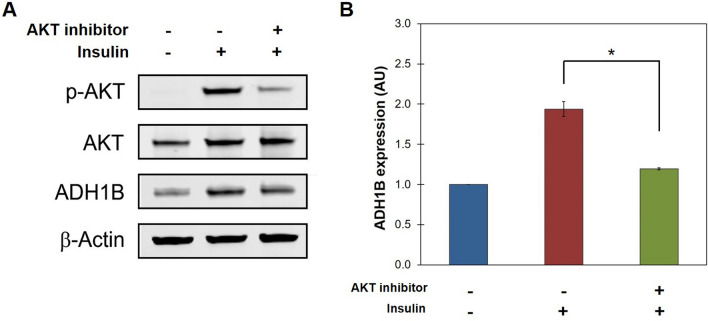
AKT is involved in insulin-mediated ADH1B expression. (A) Representative composite image of ADH1B expression with ( +) and without (−) treatment with AKT inhibitor and/or insulin. Following differentiation, cultured adipocytes were starved for 12 h and then treated with 20 µM AKT1/2-specific inhibitor (+ AKT inhibitor) for 1 h prior to treatment with 1.0 µM insulin (+ Insulin) for 1 h. Non-treated cells (−Insulin, −AKT inhibitor) were utilized as control. Total protein was isolated, resolved by SDS-PAGE, and immunoblotted with antibodies specific for phosphorylated AKT (p-AKT) or total AKT and ADH1B. β-Actin was used as loading control. A representative full-length blot is presented in Supplementary Figure S16. (B) Quantitative analysis of ADH1B expression relative to non-treated control. Western blot analysis was performed in triplicate. Fluorescence intensity was quantified and normalized to β-Actin control. Data is presented as the mean ± s.e.m. AU, Arbitrary Units; *P < 0.01.

