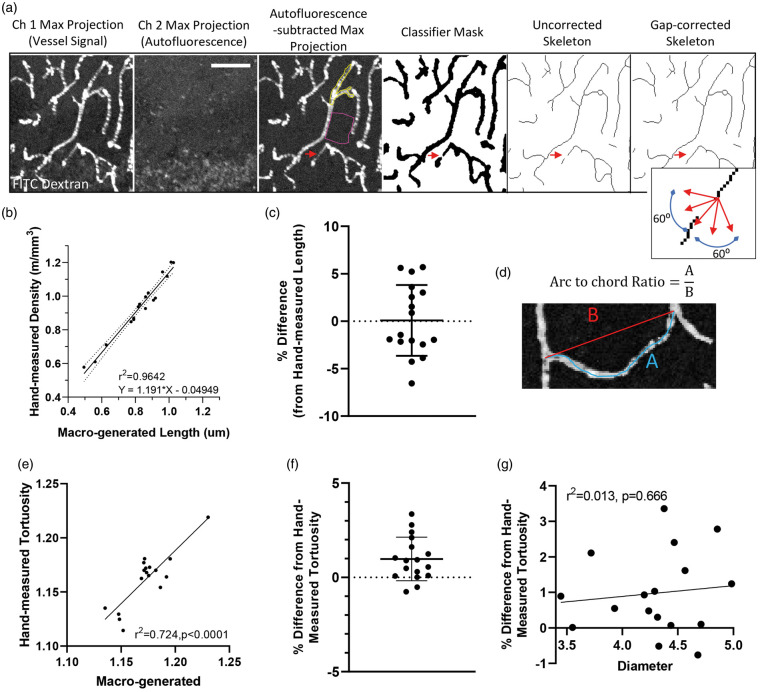
Figure 1.
Validation of automated approach for analyzing vessels. (a) Confocal image stacks from channel 1 (FITC-labeled vessels) and 2 (tissue autofluorescence) were first maximally projected with autofluorescent signal subtracted from the original image. Using a supervised learning plugin to segment fluorescent signal from background (signal outlines in yellow with background in pink), the image was skeletonized. Gaps in vessel signal (red arrows) were corrected if capillary segments were within 12 µm of each other and within a linear slope of 60° on either side of the fitted straight line segment (see inset). Scale bar = 50 µm. (b) Vessel lengths for each image were estimated from the automated macro and then plotted relative to lengths generated from a blind observer. Note the extremely tight relationship (r2=0.964) between automated and observer defined estimates. (c) Difference in lengths estimated by the two approaches after translation of macro-generated values (mean ± S.D.). (d) Image illustrating arc-chord ratio, a measurement of tortuosity. (e) Tortuosity measurements for each image (n = 17) were estimated from the automated macro and then plotted relative to those generated from a blind observer. (f) Difference in tortuosity estimated by the two approaches (mean ± S.D.). (g) Regression analysis of mean vessel diameter generated for the 17 images plotted against the difference in tortuosity generated by the two approaches. This analysis shows that vessel diameter does not influence the macro-generated estimate of tortuosity.

