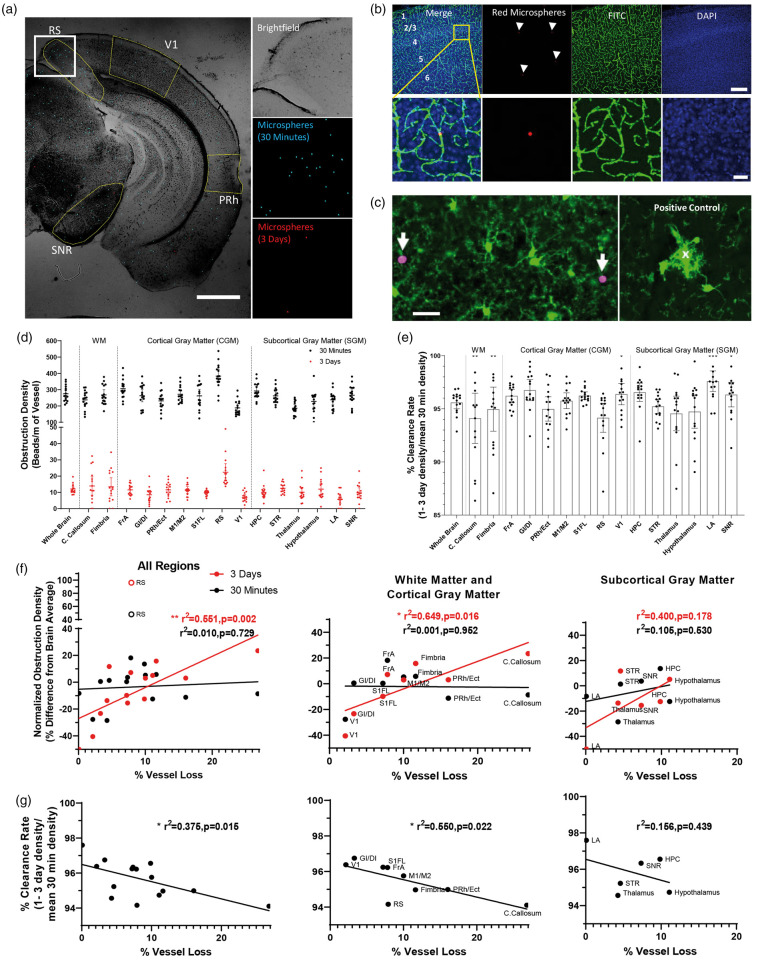
Figure 6.
Regional vulnerability to capillary obstructions is predictive of vessel loss with aging. (a) Widefield images of coronal brain sections showing transient (blue colored microspheres) and long-lasting capillary obstructions (red colored microspheres) injected 30 min or 3 days, respectively, prior to brain extraction. Scale bar = 1 mm. (b) Images show red microspheres reside within FITC-labeled capillaries in the forelimb somatosensory cortex. Scale bar = 200 µm (top row), 20 µm (bottom row). (c) Confocal images show no preferential aggregation of GFP-labeled microglia around microspheres, suggesting that microspheres do not causelocal rupture of the blood brain barrier. As a positive control (right), we show microglia aggregation around a cortical capillary ruptured in vivo. Scale bar = 20 µm. (d) Graphs show the density of short (30 min) or long-lived (3 days) microsphere obstructions across each brain region in young adult and aged mice (30 min: F(4.035,60.52)= 19.54, p < 0.0001 and 3 days: F(4.235,59.29)= 3.7.890, p < 0.0001). (e) Graphs plot the % clearance of obstructions (1–3 day/30 min density) to illustrate significant variability across brain regions (F(4.265,59.71)= 3.840, p = 0.0066). (f) Regression analysis of short or long-lived obstruction density (30 min vs. 3 days) for each brain region plotted as a function of vessel loss with aging. With the exception of the retrosplenial (RS) cortex, which was a clear outlier at both time points (identified by Grubbs test), the density of long-lived obstructions (3 days) in each brain region was significantly related to the extent of vessel loss with aging. (g) Similarly, regression analysis indicated that those brain regions more adept at clearing obstructions (higher % clearance rate values), were less likely to show age-related vessel loss. Note that these relationships were stronger for white and cortical grey matter (middle panel in (f) and (g)) than for subcortical grey matter (right panel in (f) and (g)). Data presented in (d) and (e) were analyzed using one-way repeated measures ANOVA.

