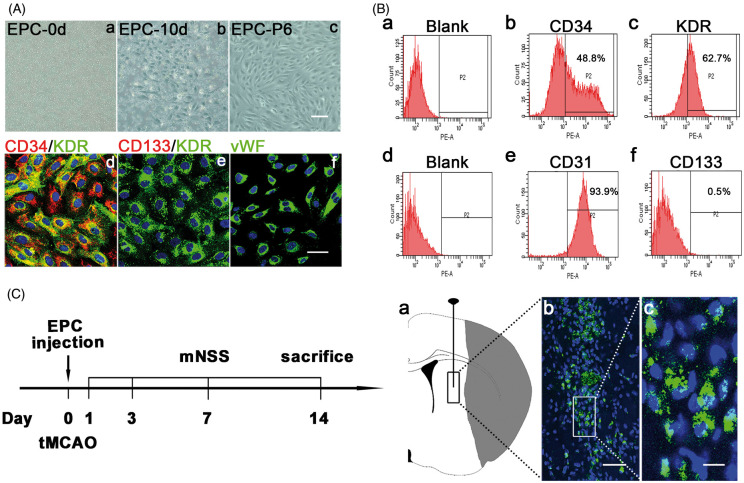
Figure 1.
EPC isolation, identification, and transplantation. (A) Images of plated monocytes on the 6-well plate after isolation (a); EPCs with cobblestone shape appeared at 10 days after isolation (b); EPCs maintained cobblestone shape at passage six (c). Scale bar=100 μm. Representative images of EPCs labeled by CD34 (red) and KDR (green) (d), CD133 (red) and KDR (green) (e), and vWF (green) (f). Scale bar=50 μm. (B) Results of flow cytometry analysis of cultured EPCs. Blank (a); CD34 (b); KDR (c); Blank (d); CD31 (e); CD133 (f). (C) The left flow chart showed the experimental design. Mice underwent tMCAO and were randomly assigned to groups. EPCs were injected into the peri-infarct region of striatum in ischemic brain within 120 min after tMCAO. The control group was injected the same volume of PBS with the same procedure. At 1, 3, 7 and 14 days after tMCAO, neurological function deficits in mice were evaluated by two blind investigators using mNSS, which included the examination of motor, sensory, and balance functions. The total score was 14. The higher the score, the more severity of neurological function.56 At 1, 3 and 14 days, mice were sacrificed and brains were collected for mRNA, protein and immunostaining assay. The right schematic diagram of ischemic brain showed the injection region of EPCs (a); Representative images of injected EPCs labeled by GFP in the peri-infarct region of striatum at 14 days after tMCAO (b); Scale bar=50 μm. Zoom of the cells in the white box of picture b (c). The nuclear (blue) of GFP labeled EPCs was positive and the morphology was round. Scale bar=10 μm.

