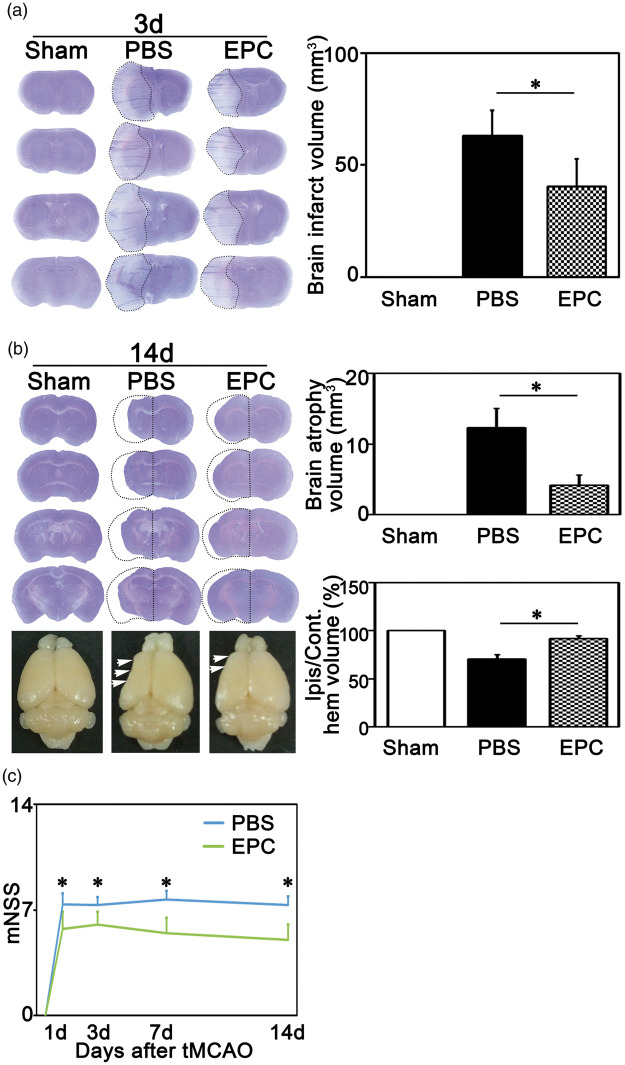
Figure 2.
EPC transplantation attenuated ischemic brain injury and neurological function deficiency. (a) Cresyl violet stained brain tissue in Sham, PBS and EPC groups at three days after tMCAO; Dotted lines represented the infarct region. The bar graph showed the quantifications of brain infarct volume among groups. Data are represented as mean±SD. n=5–6 per group. *, p<0.05. (b) Cresyl violet stained brain tissue in Sham, PBS and EPC groups at 14 days after tMCAO; The upper bar graph showed the quantification of total brain atrophy volume among groups and the lower bar graph showed the quantification of the percentage of ischemic ipsilateral hemisphere volume/contralateral hemisphere volume among groups. Data are represented as mean±SD. n=7 per group. *p<0.01. (c) mNSS in EPC and PBS groups at 1, 3, 7, and 14 days after tMCAO. Data are represented as mean±SD. n=7–12 per group. *p<0.01. mNSS: modified neurological severity scores.

