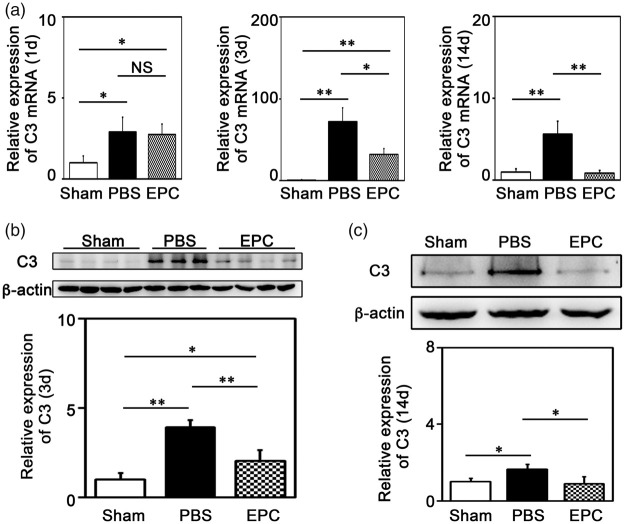
Figure 3.
EPC transplantation reduced C3 expression in the mouse brain. (a) Quantification of the expression of C3 mRNA in ischemic brain at 1 day, 3 days and 14 days after tMCAO, respectively. (b–c) Detection of C3 expression using Western blot in ischemic brain at 3 and 14 days after tMCAO, respectively. Bar graphs showed the quantification of the expression of C3. Data are represented as mean±SD. n=3–4 per group. *p<0.05, **p<0.01.

