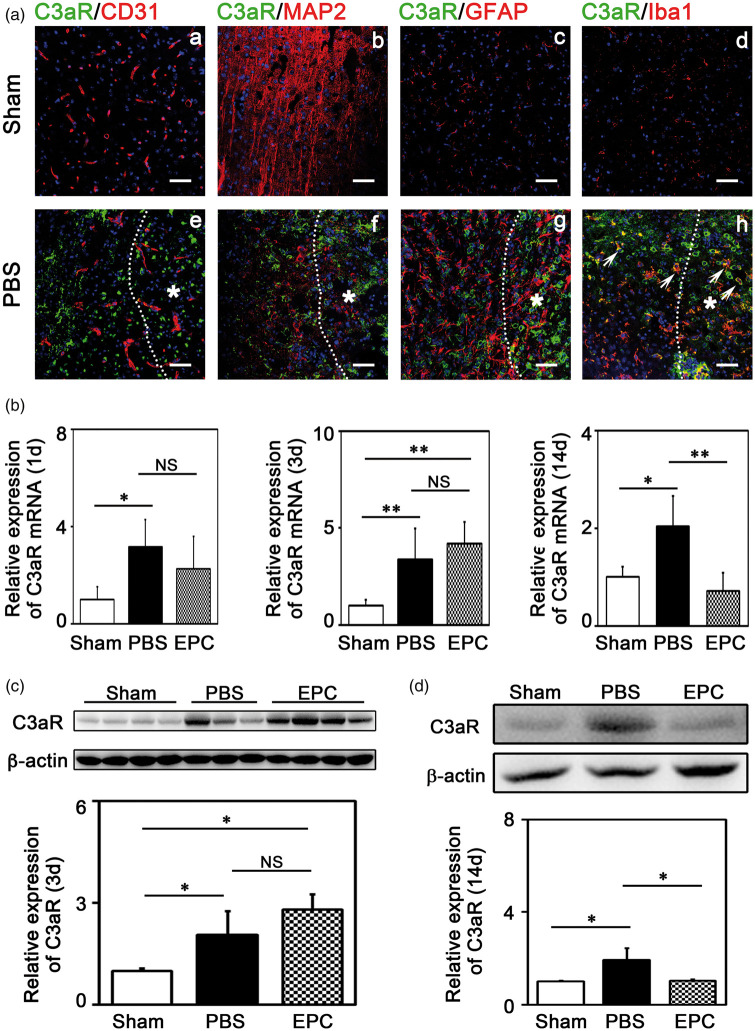
Figure 5.
EPC transplantation reduced C3aR expression in the mouse brain. (A) Representative images of double fluorescence immunostaining of C3aR (green) with CD31 (red; a, e), MAP2 (red; b, f), GFAP (red; c, g) and Iba1 (red; d, h) in mice brains of Sham (a–d) and PBS (e–h) groups at 3 days after tMCAO. Scale bar=50 μm. *Represented the infarct zone in mice brains after cerebral ischemia (e–h). White arrows showed the microglia expressing C3aR (h). (B) Quantification of the expression of C3aR mRNA in ischemic brain at 1 day, 3 days and 14 days after tMCAO, respectively. (C–D) Detection of C3aR expression using Western blot in ischemic brain at 3 and 14 days after tMCAO, respectively. Bar graphs showed the quantifications of the expression of C3aR. The data in Sham group were normalized to 1. Data are represented as mean±SD. n=3–4 per group. *p<0.05, **p<0.01.

