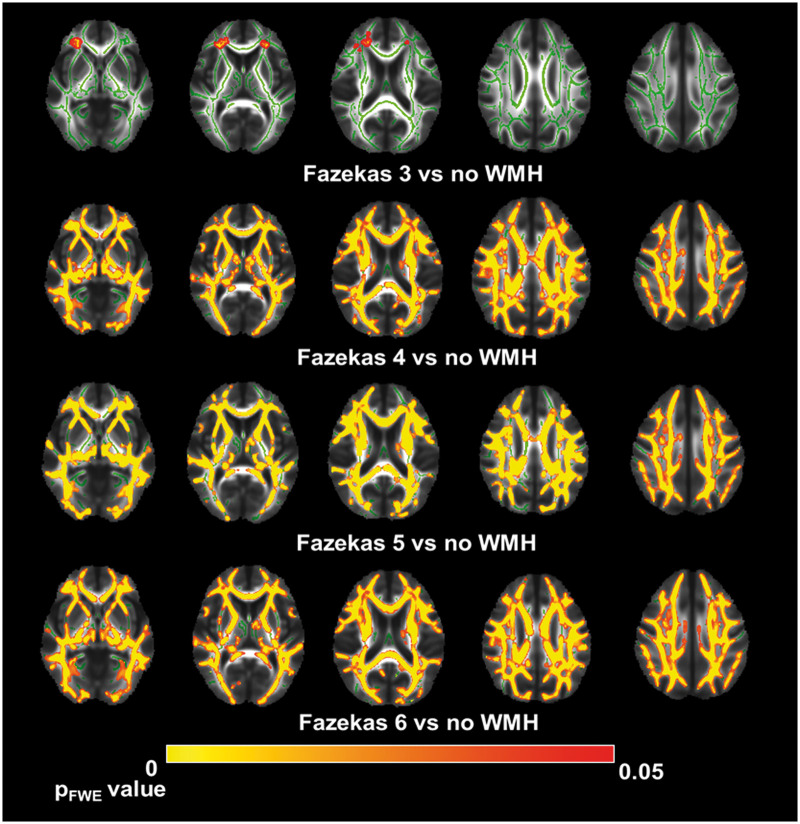
Figure 2.
Tract-based spatial statistics results between white matter hyperintensities and no WMH groups. A TBSS-derived t-map of decreased fractional anisotropy (FA) in the moderate to severe (Fazekas 3 to 6, while Fazekas 1 and 2 showed no significant changes) white matter hyperintensities (WMH) groups relative to the no WMH group is shown in red-yellow (p < 0.05; corrected for family-wise error).

