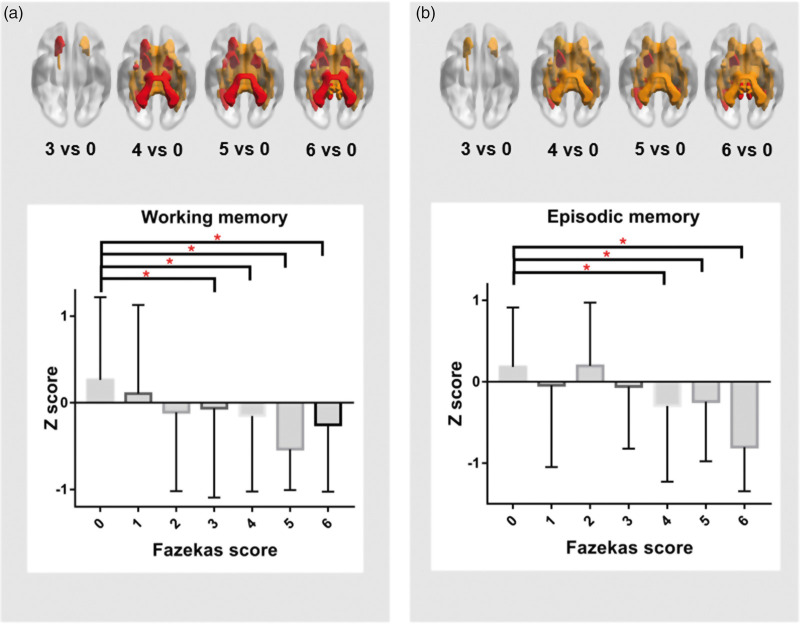
Figure 3.
Relationship between white matter microstructural changes and memory function. The significant tracts differences are shown in the upper panel (including red and yellow). Among them, the red ones presented tracts which were found to be associated with working memory (a) or episodic memory (b). The bottom panel depicts means and standard mean errors of the working memory (a)/episodic memory (b) for each of the seven groups. P-values indicate the main effect of Fazekas score on the respective memory domain. *p < 0.05.

