Figure 1.

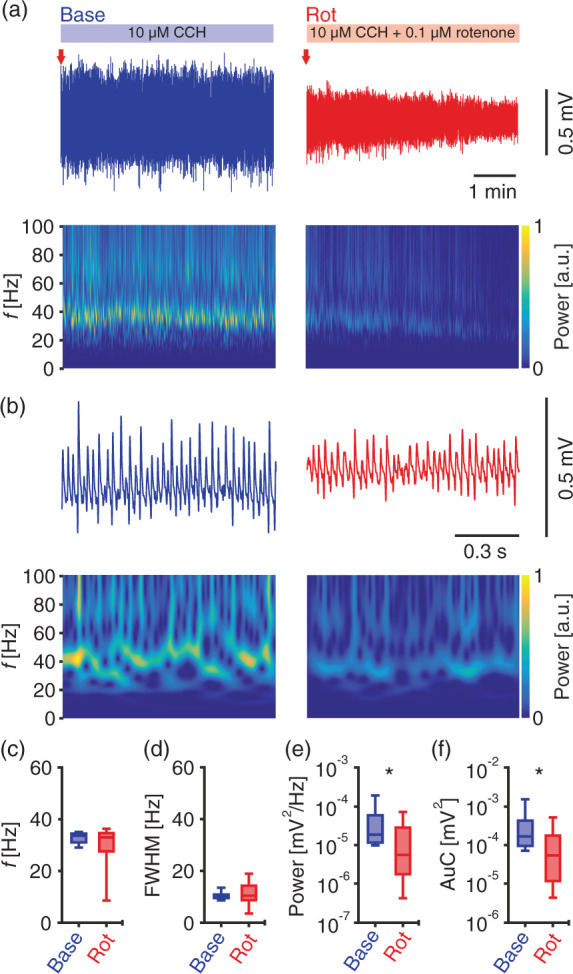
Gamma oscillations challenged by mild metabolic stress using rotenone. Local field potentials were recorded in submerged condition. (a) Sample traces of cholinergically induced gamma oscillations (blue, top left) and during additional application of rotenone (0.1 µM, red, top right). Red arrows indicate time points in (b) at higher temporal resolution. Corresponding wavelet transformations (bottom) showing the power of frequency domains over time. Heat-scale colours encode for power in arbitrary units (a.u.). Note that wavelet transformations during rotenone application are normalised to transformations during baseline. Gamma oscillations were analysed for different parameters for the shown duration of baseline (Base) and rotenone (Rot) application in (a). n/N slices/preparations: 8/3. (c) Peak frequency (f), Wilcoxon matched-pairs signed-rank test. (d) Full width at half-maximum (FWHM), paired t-test. (e) Peak of power spectral density (Power), Wilcoxon matched-pairs signed-rank test. (f) Area under the curve (AuC), Wilcoxon matched-pairs signed-rank test. *p < 0.05. Data are summarised by their median ± the interquartile range (IQR = 75% percentile – 25% percentile), error bars indicate minimal and maximal values.
