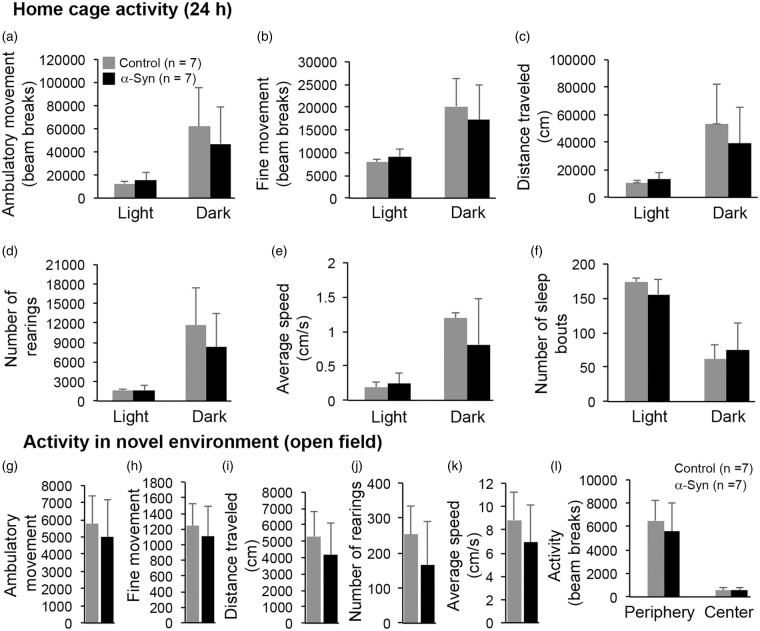
Figure 6.
General activity in home cage (a–f) and novel environment (g–l). Overall activity levels were similar among α-synuclein and control mice (P > 0.05). Various parameters tested in home cage activity are represented separately for the dark (12 h) and light (12 h) phases of the lighting cycle. Data represent mean ± SD. Home cage activity (a–f), and open field ambulatory movement (g), fine movement (h), and rearing (j): two-way ANOVA with Tukey HSD method of correction for multiple comparisons. All other data: Unpaired t-test with Welch correction.

