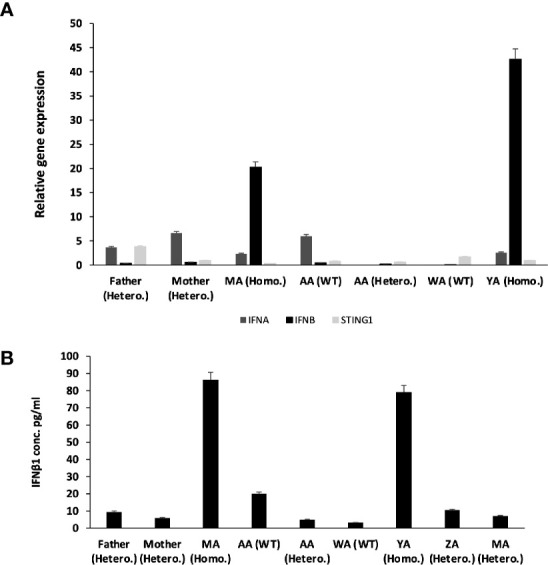
Figure 4.

Relative Gene expression for STING1, IFNα and IFNβ1 for the whole family before treatment. (A) qRT-PCR relative Quantification for Gene Expression for STING1, IFNα and IFNβ1. There is over expression for IFNβ1 in patients compared to non-affected individuals (SEM = 3.4). STING1 and IFNα showed no significant increase in expression in patients compared to non-affected individuals. STING1 (SEM = 0.44) and IFNα (SEM = 3.4). (B) IFN β1 plasma level of the family before treatment.
