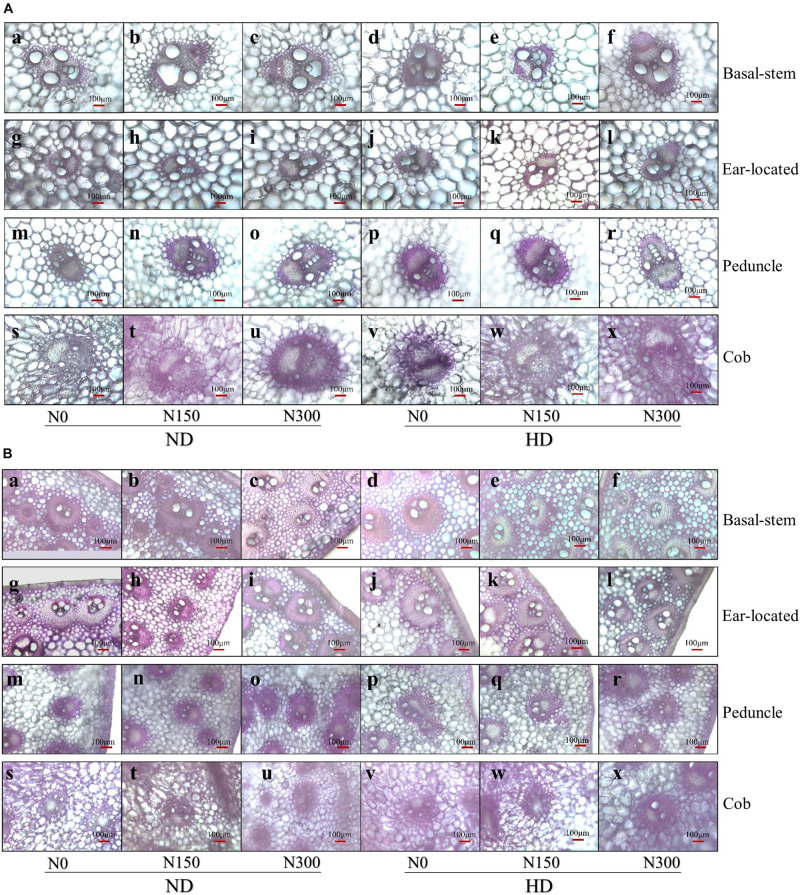
FIGURE 1.
(A) The micrograph of big vascular bundles structure at basal stem internode (a–f), ear located (g–i), peduncle (m–r), and cob (s–x) internodes. ND and HD indicate planting density of 67,500 and 90,000 plants ha− 1; N0, N150, and N300 indicate N applied at 0, 150, and 300 kg ha− 1 levels, respectively. (B) The micrograph of small vascular bundles structure at basal-stem internode (a–f), ear located (g–i), peduncle (m–r), and cob (s–x) internodes. ND and HD indicate planting density of 67,500 and 90,000 plants ha− 1; N0, N150, and N300 indicate N applied at 0, 150, and 300 kg ha− 1 levels, respectively.

