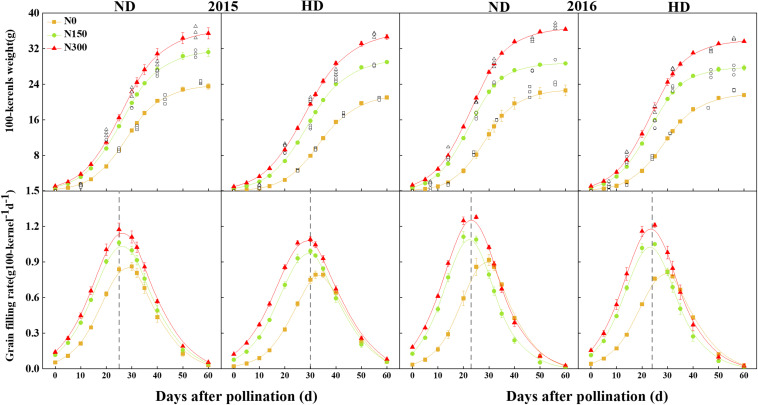
FIGURE 4.
Changes of grain filling rate and 100-kernel weight of maize affected by planting density and nitrogen fertilization level in 2015 and 2016. The reference line represents the number of days to reach the peak of grain filling. ND and HD indicate planting density of 67,500 and 90,000 plants ha− 1; N0, N150, and N300 indicate N applied at 0, 150, and 300 kg ha− 1 levels, respectively. Values shown are the mean ± SE (n = 3).

