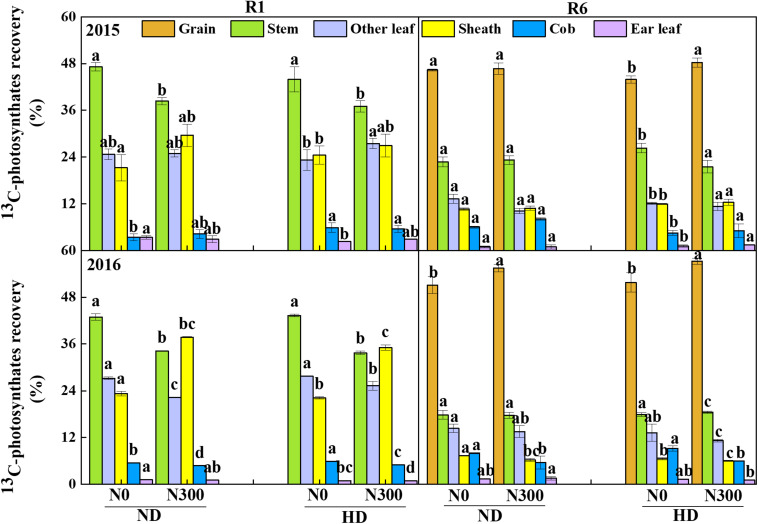
FIGURE 5.
13C-photosynthates allocation between maize organs at R1 and R6 stages in 2015 and 2016. ND and HD indicate planting density of 67,500 and 90,000 plants ha− 1; N0, N150, and N300 indicate N applied at 0, 150, and 300 kg ha− 1 levels, respectively. Different letters indicate significant difference at 5% level. Values shown are the mean ± SE (n = 3).

