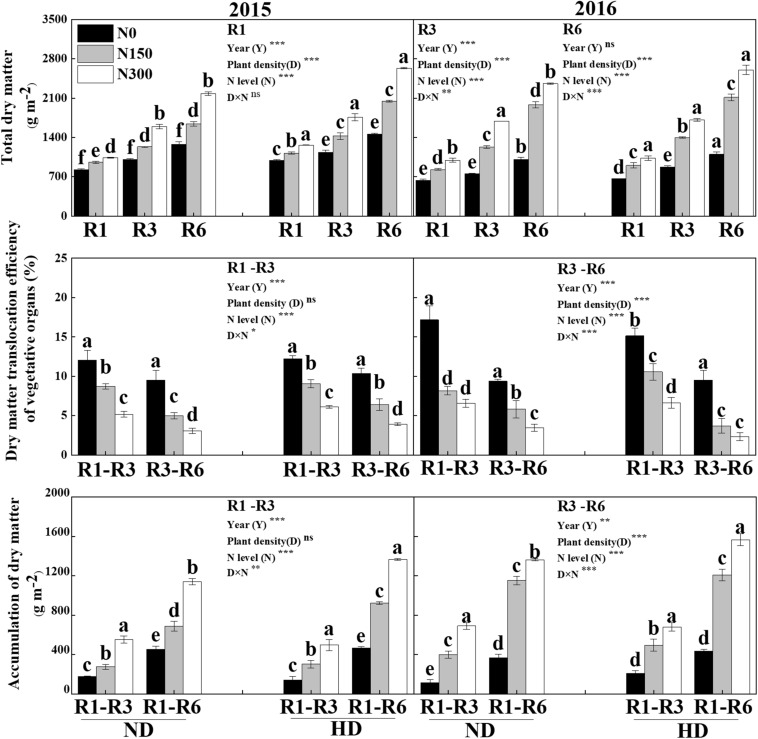
FIGURE 6.
Effect of planting density and nitrogen application on the accumulation and translocation of dry matter during maize R1, R3, and R6 stages in 2015 and 2016. ND and HD indicate planting density of 67,500 and 90,000 plants ha− 1; N0, N150, and N300 indicate N applied at 0 kg N ha− 1, 150 kg N ha− 1, and 300 kg N ha− 1 levels, respectively. Different letters indicate significant difference at 5% level. Values shown are the mean ± SE (n = 3); ns, no significance; *, **, and *** indicate significance at 5%, 1%, and 0.1% level, respectively.

