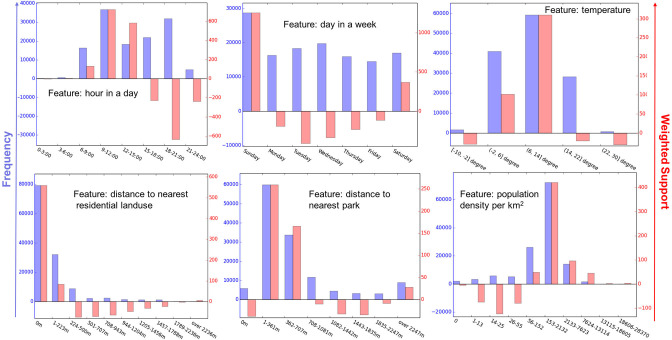
Figure 10.
The histogram of weighted support (in red) and frequency (in blue) of all values for six features. Here, the frequency value indicates how often runs are performed under a certain situation (i.e., a feature value), while the weighted support value implies how often the situation can be associated with either a longer or shorter running distance than average (correspond to a positive and negative value, respectively).

