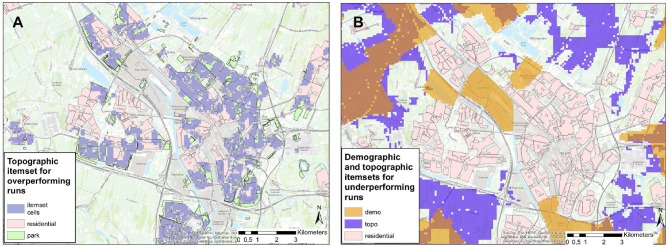
Figure 11.
Maps for the city of Utrecht illustrating frequent topographical and demographical situations in Table 3. In (A), the areas of purple correspond to a topographical situation (0 m from residential area, 0–361 m from parks), which is often associated with a longer running distance. In (B), the areas in purple and orange correspond to a topographical situation (0 m from agriculture, 0% cov. of recreation, 0% cov. of residential) and a demographical situation (population density in [26–55]) with a shorter running distance.

