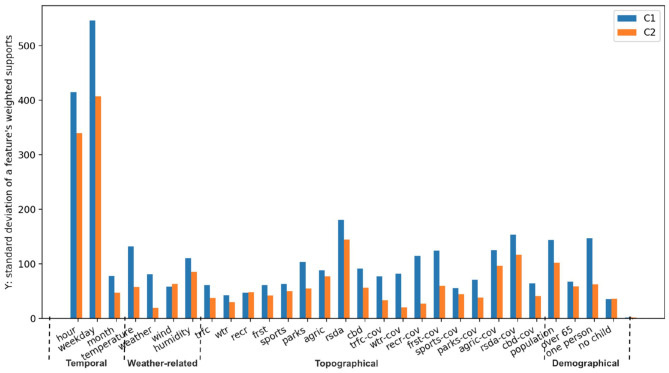
Figure 9.
The comparison between C1 and C2 user group for all 29 features. The abbreviated names of features at x-axis are explained in Table 3, where y-axis represents the standard deviation computed from a list of weighted supports corresponding to all values of each feature.

