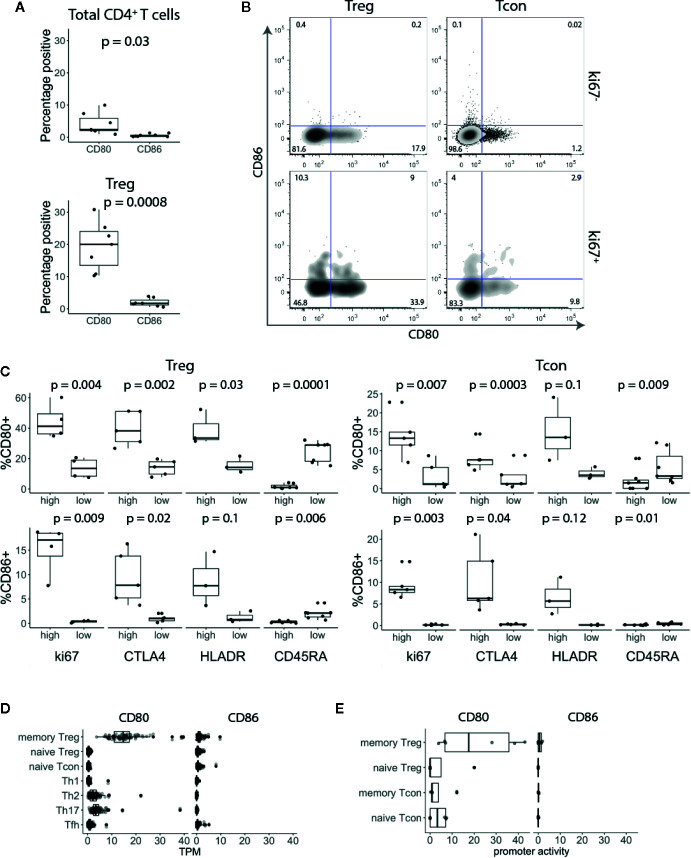
Figure 1.
CD80 and CD86 are expressed on human in vivo activated conventional and regulatory T cells. (A) Graphs show percentage of CD80+ and CD86+ T cells across seven donors. (B) Cells were gated on CD3+ CD4+ T cells and based on FoxP3 expression divided into Treg and Tcon. Cells were further gated on Ki-67 and analysed for CD80 and CD86 expression. (C) Graphs show percentage of CD80+ and CD86+ Tcon and Treg expressing either high or low levels of Ki-67, CTLA-4, HLA-DR and CD45-RA. (D, E) Boxplots show CD80 and CD86 RNA expression levels (D) and promoter activity (E). Data were downloaded from DICE and FANTOM5 databases respectively. TPM—transcripts per million. All p-values were calculated using unpaired two-tailed T-test.

