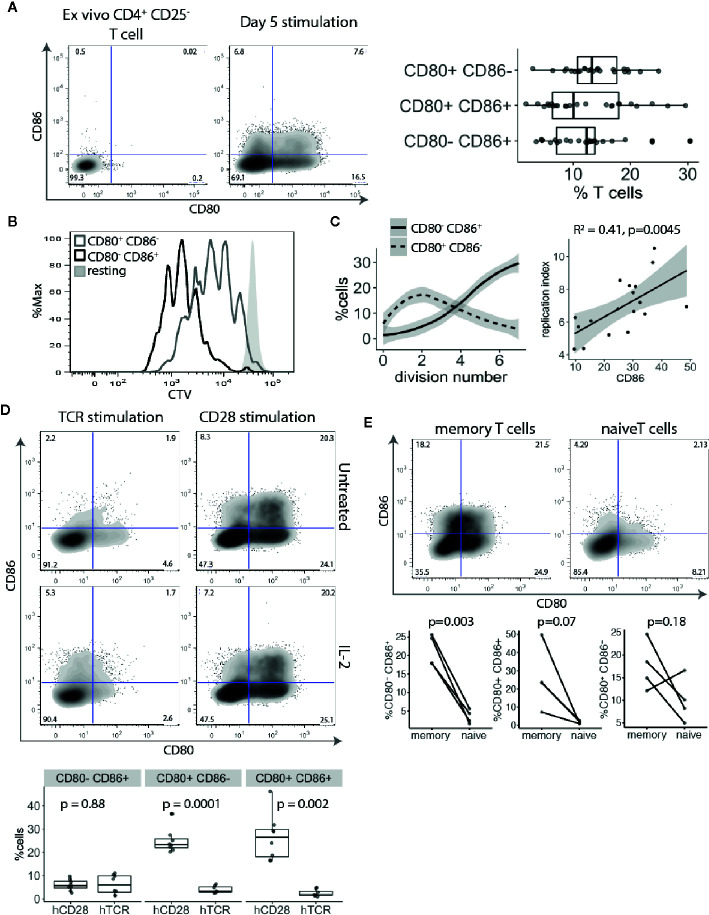
Figure 2.
CD80 and CD86 are upregulated on human T cell activation. (A) Cell trace Violet labelled CD4+CD25- T cells were stimulated for five days with anti-CD3/anti-CD28 coated beads and analysed for CD80 and CD86 expression on dividing cells. Representative FACS plots of CD80 and CD86 expression before stimulation and five days following stimulation. Graph shows the percentage of divided T cells expressing either CD80, CD86 or both across multiple donors. (B) Histogram shows proliferative capacity of CD80+ and CD86+ T cells. (C) Left graph shows the percentage of CD80+CD86- and CD80-CD86+ T cells across different divisions. Right graph shows correlation between percentage of CD86+ T cells and replication index. P-value and R2 from linear regression model. (D) Cell trace Violet labelled CD4+CD25- T cells were stimulated with 0.5 μg/ml anti-CD3 or 0.5 μg/ml anti-CD28 cross linked with CHO-FcR-expressing cells and analysed for CD80 and CD86 expression on dividing cells. Representative FACS plots and pooled data are shown for percentage of CD80 and CD86 expressing cells in divided cells. Cultures were supplemented with 100 U/ml of IL-2 as indicated. (E) Graphs show the percentage of stimulated and dividing naive and memory T cells expressing CD80, CD86 or both. P-values were calculated using paired two-tailed T-test.

