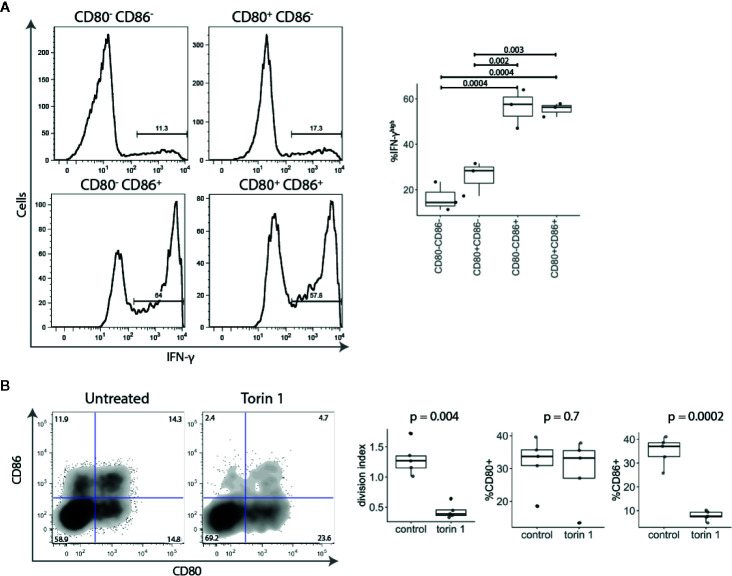
Figure 3.
Activated CD86+ cells express high levels of IFN-γ and are mTOR-dependent. (A) Five days post stimulation, T cells were sorted into four populations based upon CD80 and CD86 expression, and restimulated with PMA and Ionomycin. All four populations of cells were gated on the same level of division. Representative histograms and collated data of percentage of IFN-γhigh T cells are shown. P-values were calculated using one-ANOVA. (B) Cell trace Violet labelled CD4+CD25- T cells were stimulated with anti-CD3/anti-CD28 beads for five days in the presence or absence of mTOR inhibitor Torin 1 (25 nM). FACS plot of CD80 and CD86 expression in gated divided (CTVlow) T cells. Graphs show effect of Torin 1 on cell division (represented with division index), CD80 and CD86 expression. P-values were calculated using unpaired two-tailed T-test.

