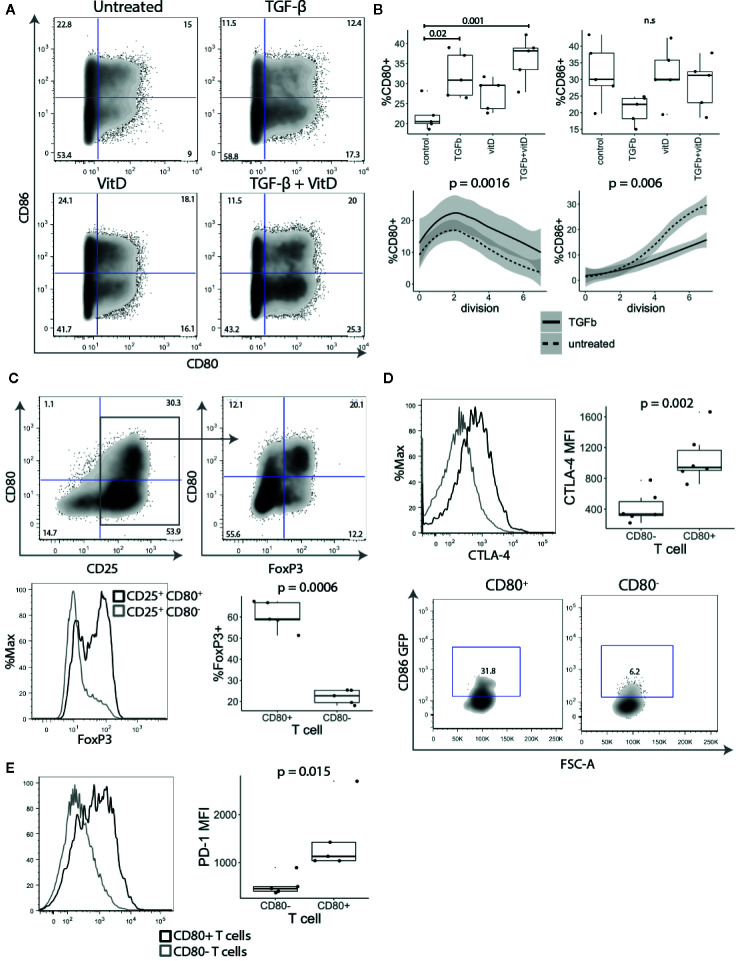
Figure 4.
TGF-β and vitamin D upregulate CD80. (A) Treg depleted CD4+CD25- T cells were stimulated with CD3/CD28 beads in presence of 1 ng/ml TGF-β, 10 nmol 1,25-Dihydroxyvitamin D3 (vitD) or TGF-β together with vitD. Plots show representative CD80 and CD86 staining. (B) Top panel shows the percentage of CD80 and CD86 expressing cells across different cell culture conditions. Bottom panel shows the percentage of CD80 and CD86 expressing cells across different divisions stimulated in presence or absence of 1 ng/ml TGF-β. Data points represent individual donors, P-values were calculated using one-ANOVA. n.s., not significant. (C) CD4+CD25- T cells were stimulated with anti-CD3/anti-CD28 beads in the presence of 1 ng/ml TGF-β. Five days post stimulation, beads were magnetically removed and cells were rested for two days in 100 U/ml of IL-2. Representative FACS plots and graph for percentage of FoxP3 expressing cells in gated CD25+CD80+ and CD25+CD80- T cells. P-values were calculated using paired two-tailed T-test. (D) Representative histogram (gated on divided T cells) and collated data of cycling CTLA-4 (37°C) median fluorescence intensity (MFI). Five days post stimulation T cells were cocultured with CHO-CD86 GFP for 6 h in 1:1 ratio in the presence of 20nM Bafilomycin A1 to measure transendocytosis. P-values were calculated using paired two-tailed T-test. (E) Representative histograms and collated data of percentage of PD-1 expression in CD80+ and CD86+ T cells. P-values were calculated using paired two-tailed T-test.

