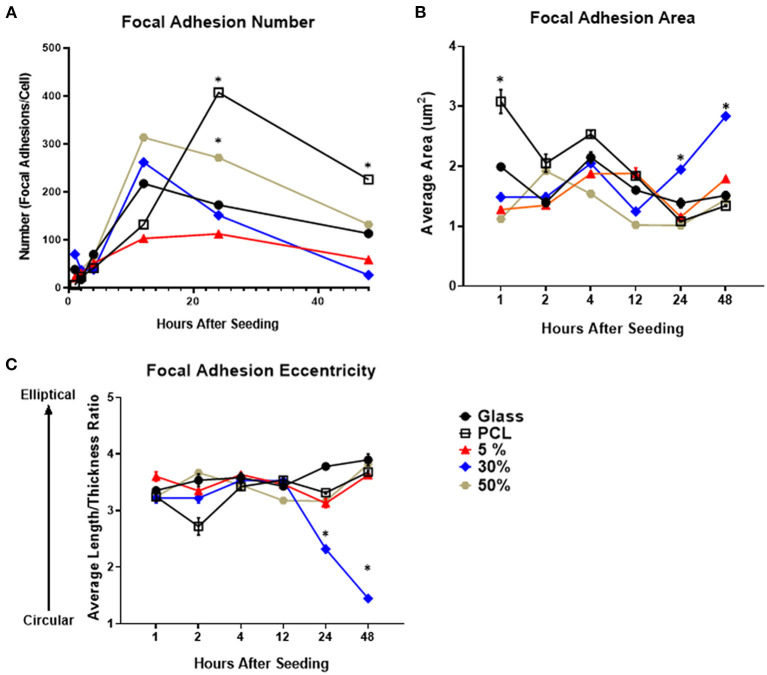
Figure 2.
Focal adhesion number, size, and morphology over time on each of the evaluated substrates. Temporal quantification of focal adhesion (A) number, (B) area, and (C) eccentricity over time on either glass, PCL, 5, 30, or 50% substrates. *p < 0.05 compared to all other groups at the same time point. n = 3 samples with each sample consisting of ~5–75 cells or ~500–5,000 focal adhesions per sample.

