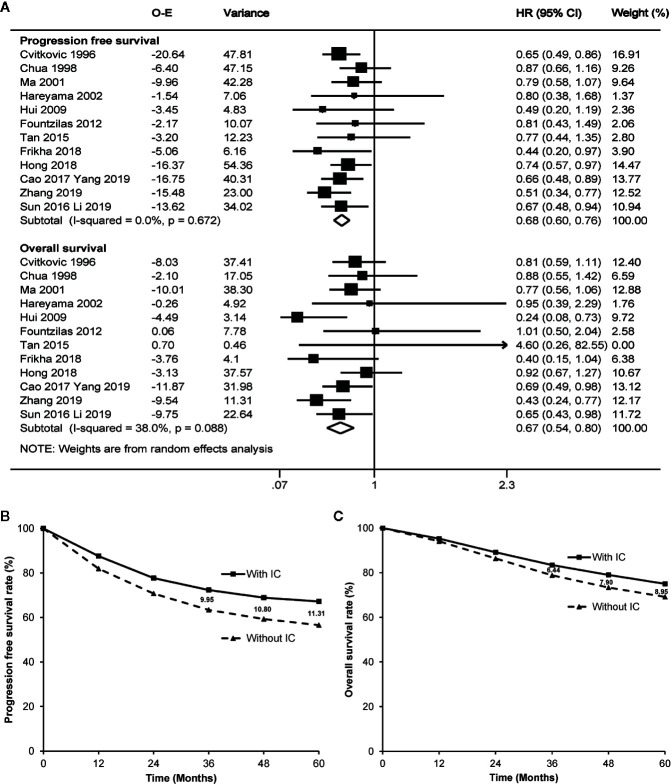
Figure 2.
Forest plot (A) and estimated survival curves (B, C) for progression free survival and overall survival. The numbers on the figure (B, C) mean absolute increase of the survival rates. IC, induction chemotherapy; O-E, observed minus estimated number of events; CI, confidence interval; HR, hazard ratio.

