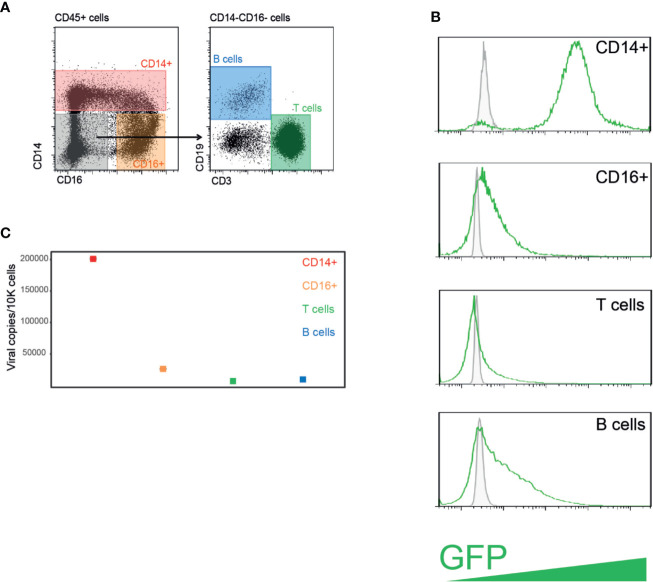
Figure 1.
PBMCs from healthy individuals are efficiently infected with HCMV following experimental infection. (A) HCMV infected PBMCs were FACS sorted to four distinct cell populations. (B) Flow cytometry analysis of GFP expression levels in PBMCs experimentally infected with HCMV strain TB40/E-GFP at 22 h post infection. Uninfected control cells and infected cells are shown in grey and green lines, respectively. (C) Quantification of viral genomes by ddPCR in indicated PBMCs populations presented as copies per 10,000 cells. Graph reflects mean and 95% CV of Poisson distribution, calculated from two technical replicates per sample.

