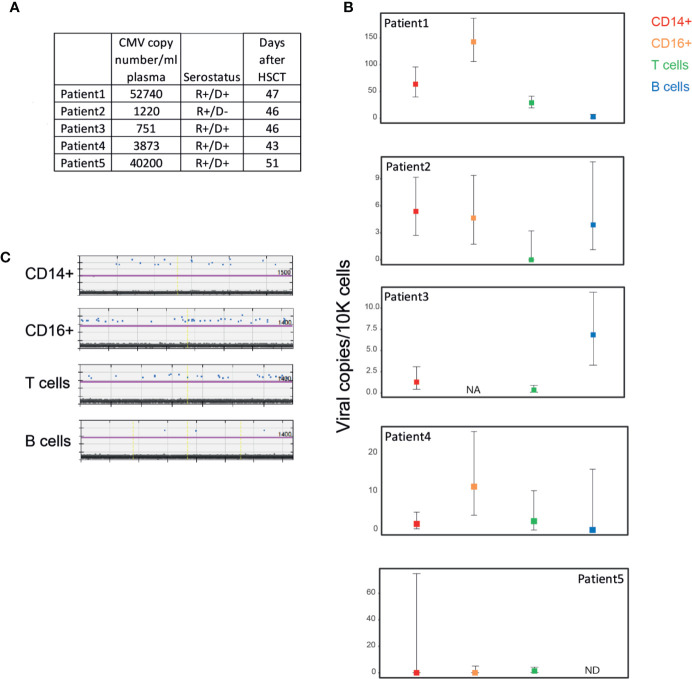
Figure 2.
Low levels of HCMV DNA detected in PBMCs from HCMV reactivating HSCT patients during HCMV DNAemia. (A) Description of samples from five HCMV reactivating HSCT patients. HCMV copy number was measured by RT-qPCR. PBMCs from HSCT patients were sorted to four distinct cell populations as described in Figure 1A . (B) Quantification of viral genomes in the indicated PBMC populations from individual HSCT patients, presented as copies per 10,000 cells. Graph reflects mean and 95% CV of Poisson distribution, calculated from at least 2 technical replicates per sample. NA, not available; ND, not detected; i.e. positive event number in the sample is <=2. (C) ddPCR results of PBMC populations from patient 1, technical replicates separated by yellow vertical lines. The magenta line marks the threshold.

