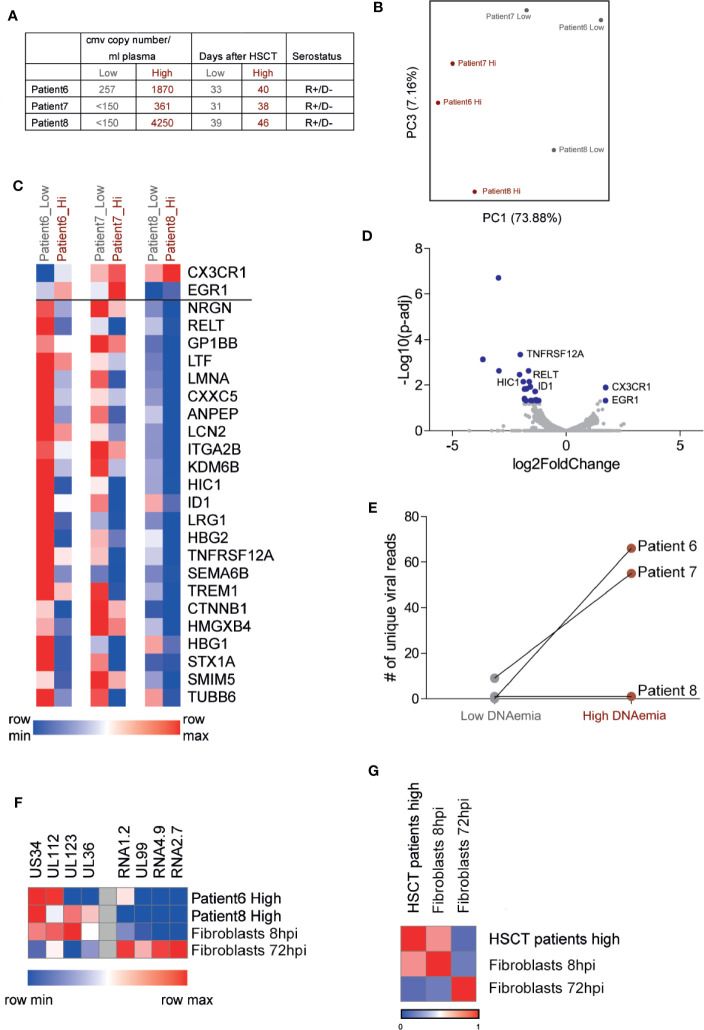
Figure 3.
RNA sequencing analysis of PBMCs from HCMV reactivating HSCT patients reveals low viral transcript levels and a discernible host response to active HCMV infection. (A) Description of samples from three HCMV reactivating HSCT patients. HCMV copy number was measured by RT-qPCR. (B) Principal component analysis of the transcriptional profile of PBMCs from three HSCT patients at two time points. (C) Heat map of 25 host genes significantly differentially expressed (fold change>2 and FDR<0.05) in all three HSCT patients comparing samples of low and high DNAemia. (D) Volcano plot of statistical significance (-log10 p-value) against log 2 ratio of host transcript levels between low and high DNAemic samples of PBMCs from three HCMV reactivating HSCT patients, based on RNA-seq data. Blue dots mark significantly up or down regulated genes (fold change>2, adj-p value<0.05). (E) Total number of viral reads in PBMCs from low and high DNAemic samples of three HCMV reactivating HSCT patients. (F) Heat map showing the expression level of representative immediate early stage and late stage viral genes in PBMCs of HSCT patients or experimental lytically infected fibroblasts at 8 or 72 h post infection. (G) Heat map showing Pearson’s correlation between viral gene expression program in PBMCs from HSCT patients and experimental lytically infected fibroblasts at 8 or 72 h post infection.

