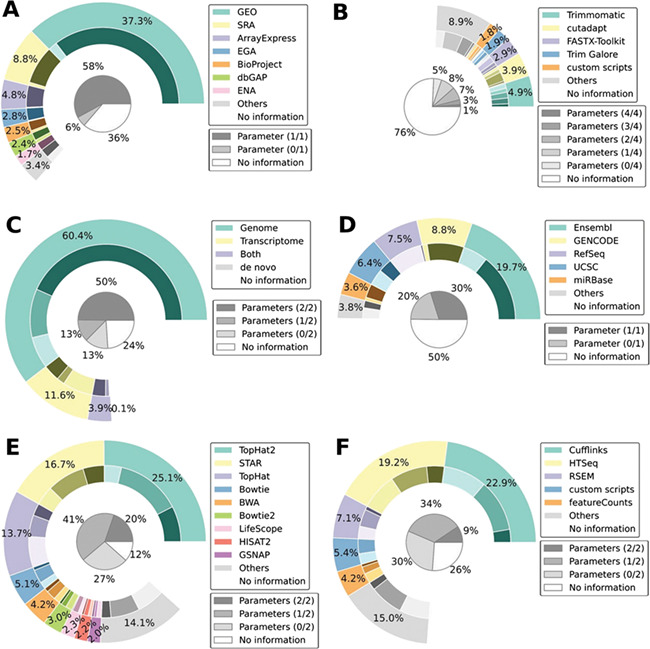
Figure 2.

RNA-seq reported methodology is incomplete. Distribution of software and reference usage for the six methodological steps of an RNA-seq experiment (A. dataset, B. preprocessing tool, C. alignment type, D. genomic annotation, E. alignment tool and F. quantification tool). The outer donut chart illustrates the distribution of the primary criterion for each step. The inner donut chart illustrates the degree of parameter specification: the darker the shade, the more complete the information. The inner pie chart is the summation of all shades from the inner donut. Complete results are available as Supplementary data.
