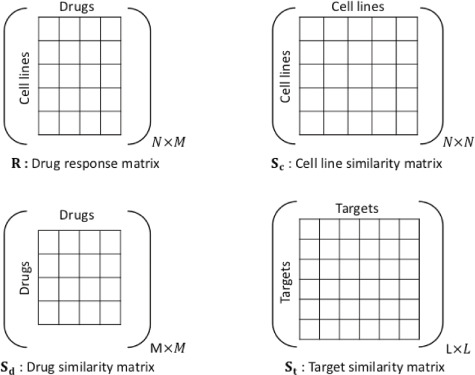
Fig. 1.

 is the drug response matrix, the main input.
  is drug similarity matrix where the similarity between drugs i and j is denoted as
  .
.  and
and  are similarity matrices of cell lines and targets, respectively.

 is the drug response matrix, the main input.
  is drug similarity matrix where the similarity between drugs i and j is denoted as
  .
.  and
and  are similarity matrices of cell lines and targets, respectively.