Fig. 2.

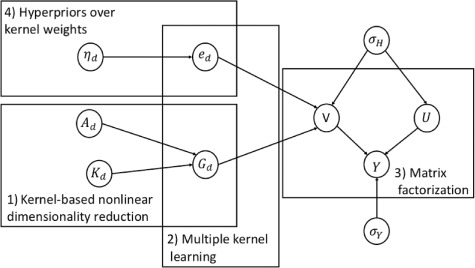
Graphical representation of cwKBMF showing four main parts of the model. The difference between personalized QSAR and cwKBMF is part 4. The same diagram can be drawn for latent factor  .
.

Graphical representation of cwKBMF showing four main parts of the model. The difference between personalized QSAR and cwKBMF is part 4. The same diagram can be drawn for latent factor  .
.