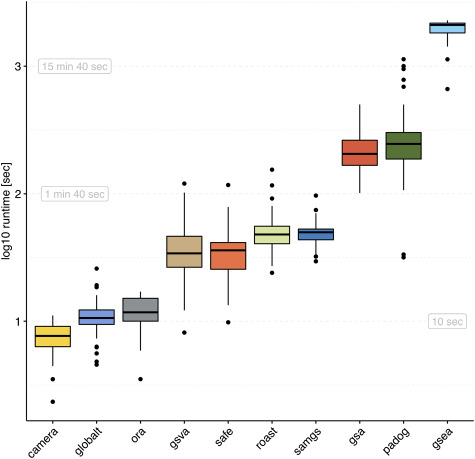
Figure 2.

Runtime. Elapsed processing times ( -axis, log-scale) when applying the enrichment methods indicated on the
  -axis to the 42 datasets of the GEO2KEGG microarray compendium. Gene sets were defined according to GO-BP (
 ). Computation was carried out on an Intel Xeon 2.7 GHz machine. Runtimes for the TCGA RNA-seq compendium and when using KEGG gene sets are shown in Supplementary Figure S8.
