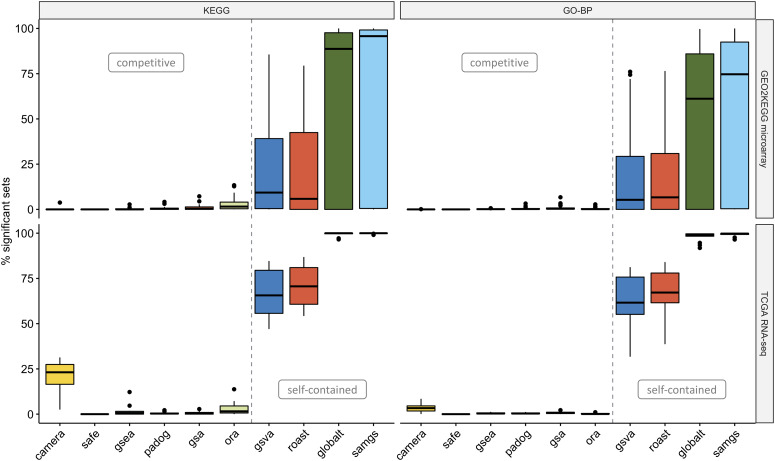
Figure 3.

Statistical significance. Percentage of significant gene sets (FDR  ,
,  -axis) when applying methods to the GEO2KEGG microarray compendium (top, 42 datasets) and the TCGA RNA-seq compendium (bottom, 15 datasets). Gene sets were defined according to KEGG (left, 323 gene sets) and GO-BP (right, 4631 gene sets). The gray dashed line divides methods based on the type of null hypothesis tested [6]. Supplementary Figure S8 shows the percentage of significant gene sets when using a nominal significance threshold of 0.05.
