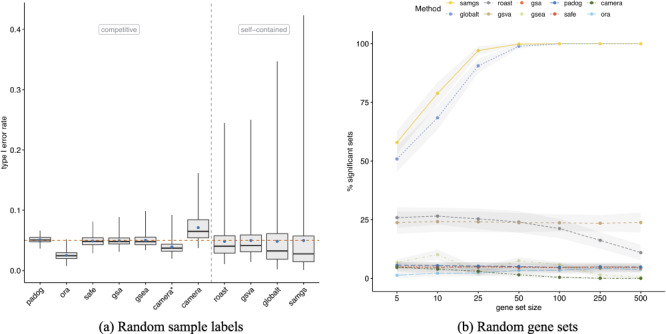
Figure 4.

Random sample labels and random gene sets. (a) Type I error rates ( -axis) as evaluated on the dataset from Golub et al. [42] by shuffling sample labels 1000 times and assessing in each permutation the fraction of gene sets with
  . Gene sets were defined according to GO-BP (
 ). Blue points indicate the mean type I error rate and the red dashed line the significance level of 0.05. The gray dashed line divides methods based on the type of null hypothesis tested [6]. *Application of CAMERA without accounting for inter-gene correlation (default: inter-gene correlation of 0.01). Supplementary Figure S5 shows type I error rates when using KEGG gene sets. Supplementary Figure S6 shows type I error rates for all four combinations of benchmark compendium and gene set collection. (b) Percentage of significant gene sets (
 ,
,  -axis) when applying methods to the Golub dataset (true sample labels) and using 100 randomly sampled gene sets of defined size (
 -axis). Shown is the mean
  standard deviation (gray bands) across 100 replications of the simulation experiment.
