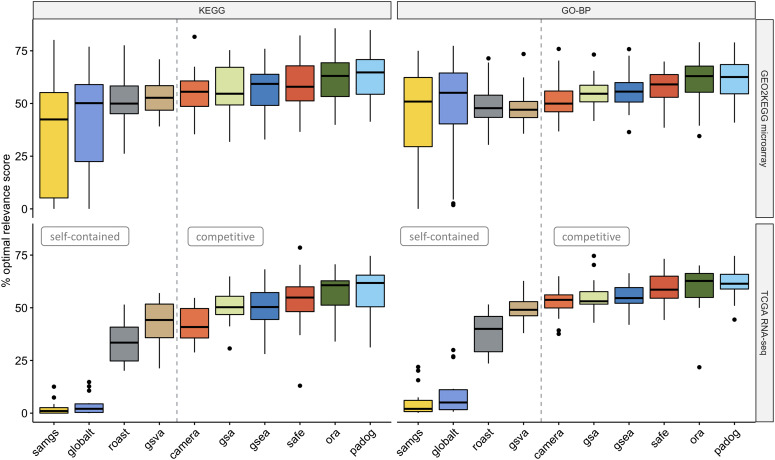
Figure 5.

Phenotype relevance. Percentage of the optimal phenotype relevance score ( -axis) when applying methods to the GEO2KEGG microarray compendium (top, 42 datasets) and the TCGA RNA-seq compendium (bottom, 15 datasets). Gene sets were defined according to KEGG (left, 323 gene sets) and GO-BP (right, 4631 gene sets). The gray dashed line divides methods based on the type of null hypothesis tested [6]. The phenotype relevance score of a method
  applied to a dataset
  is the sum of the gene set relevance scores, weighted by the relative position of each gene set in the ranking of method
  (as outlined in Figure 1 and detailed in Phenotype relevance 2.6 section).
