Figure 2.
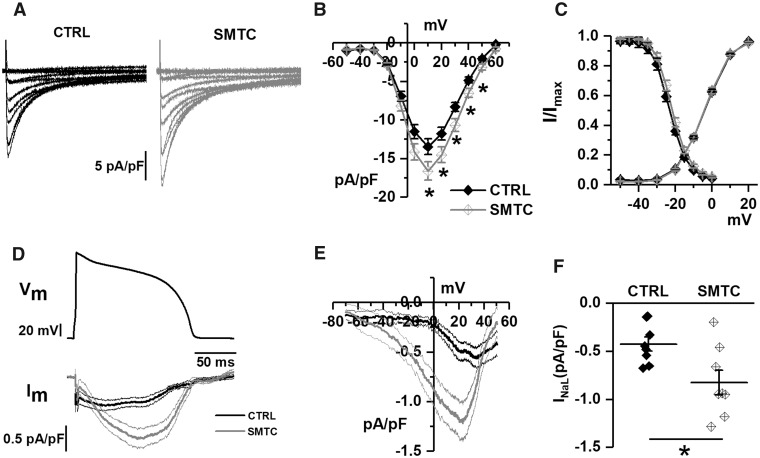
Effect of NOS1 inhibition on ICaL and INaL in GP cardiomyocytes. (A) Representative ICaL recordings at different voltages in control (CTRL) and during NOS1 inhibition (SMTC); (B) average (±SE) I/V relationships of peak ICaL density in CTRL and during NOS1 inhibition; (C) average steady-state activation and inactivation curves in CTRL and NOS1 inhibition. (D) Long AP waveform (top) and average traces of INaL (bottom). (E) Dynamic I/V relationship of traces shown in D. (F) TTX-sensitive current (INaL) in control and under NOS1 inhibition. Sample sizes: CTRL n = 25/4 and SMTC n = 20/3 for A–C panels; CTRL n = 8/2 and SMTC n = 8/2 for D–F panels. *P < 0.05 vs. CTRL from two-way ANOVA for repeated measurements.

