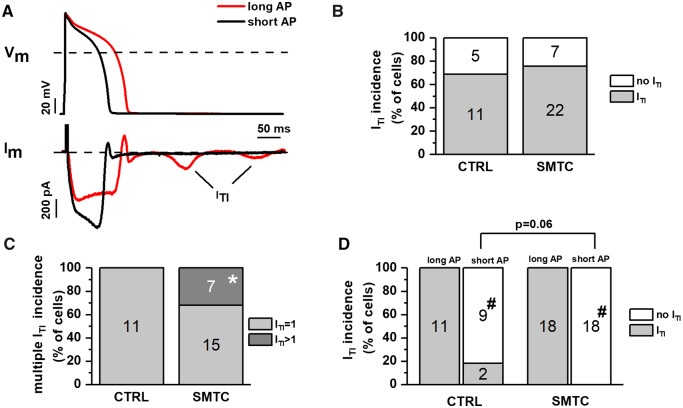
Figure 3.
Interaction between NOS1 inhibition and APD in inducing ITI events. ITI events were induced by ISO 1 nM under AP clamp. (A) Representative membrane current recordings during long (APD90 = 140 ms, red) and short (APD90 = 100 ms, black) AP waveforms in the same myocyte; ITI events are shown (arrows). (B) Percent of cells with no ITI (white) or at least one ITI (grey) event in CTRL and during NOS1 inhibition. (C) Percent of cells with one ITI event (light grey) or >1 ITI events (dark grey) in CTRL and during NOS1 inhibition. (D) Effect of APD shortening on ITI incidence in CTRL and during NOS1 inhibition. Sample sizes: CTRL n = 16/3 and SMTC n = 29/6 for B; CTRL n = 11/3 and SMTC n = 22/6 for C; and CTRL n = 11/3 and SMTC n = 18/6 for D. *P < 0.05 vs. CTRL. #P < 0.05 vs. long AP from the χ2 test.

