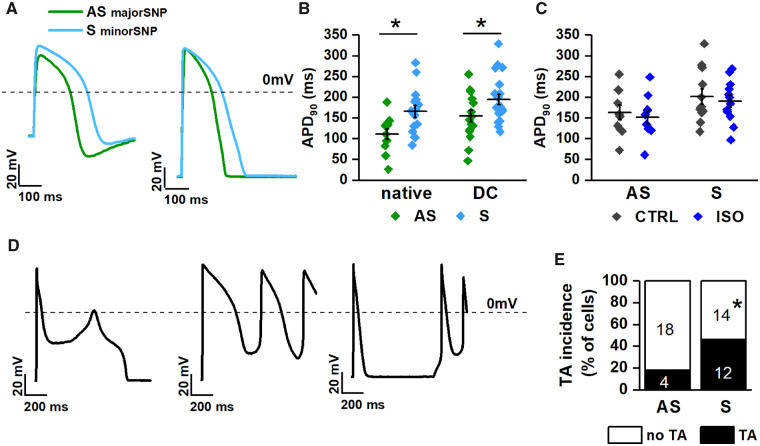
Figure 5.
Comparison of electrical activity between AS and S hiPSC-CMs. (A) AP recordings in native (left) and DC (right) conditions; (B) APD90 in AS (green) vs. S (blue) hiPSC-CMs in native (left) and DC (right) conditions. (C) Effect of ISO (1 nM) on APD90 in AS vs. S hiPSC-CMs (DC condition). (D) Types of afterpotentials and trigger activity (TA) recorded in hiPSC-CMs. (E) Incidence of TA in AS vs. S hiPSC-CMs (DC condition). Sample sizes: AS nat n = 12/6 and S nat n = 15/7; AS DC n = 16/6 and S DC n = 21/7, for B; AS n = 12/6 and S n = 16/7 for C; AS n = 22/6 and S n = 26/7 for E. *P < 0.05 vs. AS from the unpaired Student’s t-test and χ2 test.

