
. 2020 Feb 1;22(1):393–415. doi: 10.1093/bib/bbz170
© The Author(s) 2020. Published by Oxford University Press.
This is an Open Access article distributed under the terms of the Creative Commons Attribution License (http://creativecommons.org/licenses/by/4.0/), which permits unrestricted reuse, distribution, and reproduction in any medium, provided the original work is properly cited.
Fig. 5.
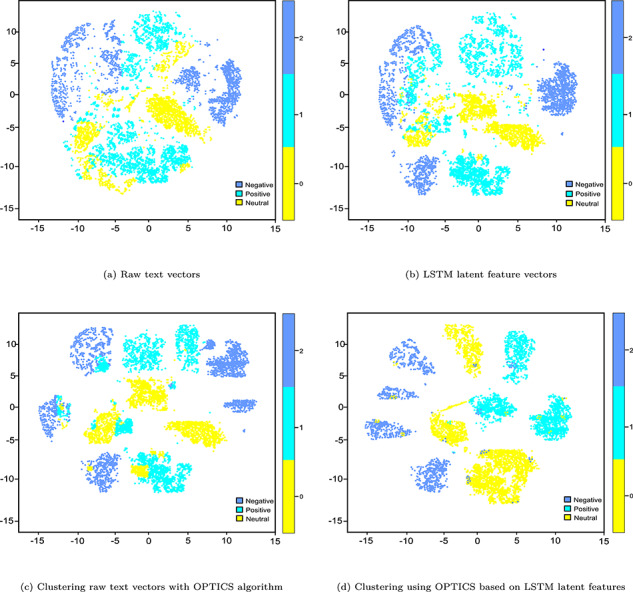
t-SNE plots of different stages in text clustering.