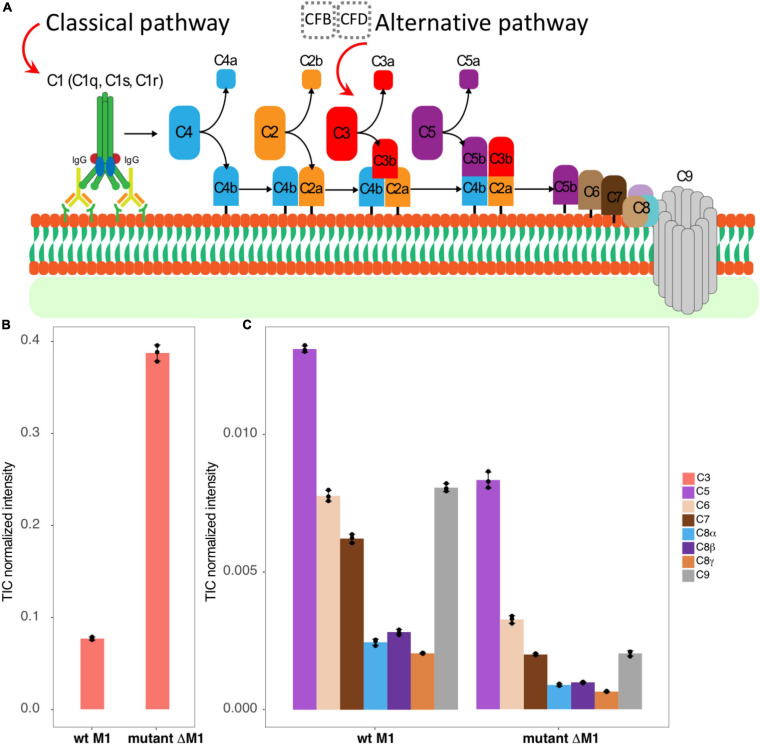
FIGURE 1.
The studied system. (A) A schematic view represents briefly how classical and alternative complement pathways activated by antigen–antibody interaction, or by factors B and D, lead to C3 convertase production that eventually brings the MAC C5b–C9 components to assemble as a pore on the surface of the bacteria. (B,C) The bar graphs represent TIC-normalized intensity of complement proteins in human plasma adsorption samples. It provides a comparison between the wt strain SF370 (left) and the mutant strain ΔM1 (right) for C3 (B), C5, C6, C7, C8, and C9 components (C).

