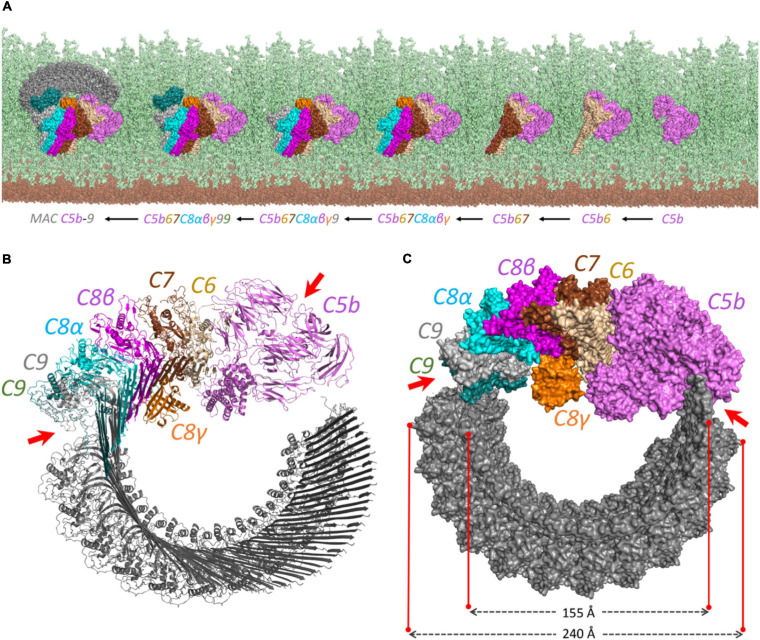
FIGURE 3.
The proposed structural model for the MAC complex. (A) The MAC C5b–9 complex formation on the surface of Gram-positive bacteria. It represents how the complement proteins are added one by one and interact together to constitute the MAC complex. The view is from above to show the complete pore formation on the top of the peptidoglycan surface. The cell membrane and peptidoglycan layer are shown in brown and light green, respectively. (B) The cartoon view of each component shows how the interaction between C5b and C8 initiates the multiple binding of C9 to form the pore. (C) The surface representation. The diagonal length of the inside and the outside of the pore is around 15.5 and 24 nm, respectively. The irregular patterns in C5b–C6 and C9–C9 interactions are shown by red arrows on both (B) and (C) panels.

