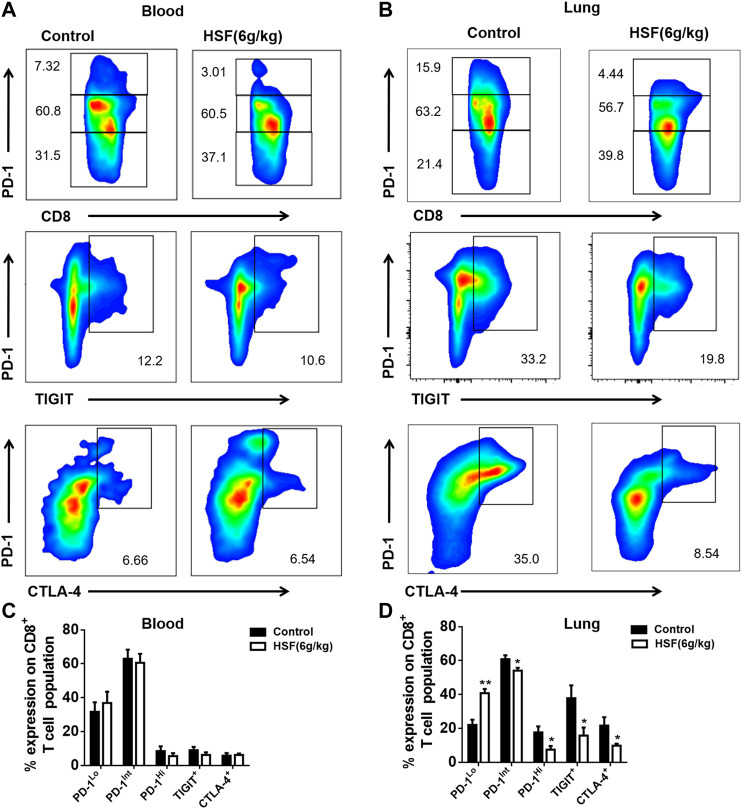
FIGURE 3.
Effect of HSF on PD-1, TIGIT, and CTLA-4 in the blood and lung samples of the breast cancer postoperative metastasis mice. (A) Representative image of PD-1, TIGIT, and CTLA-4 population in the blood. (B) Flow cytometry of PD-1, TIGIT, and CTLA-4, expressed as percentage of CD8+ T cells in the blood. (C) Representative image of PD-1, TIGIT, and CTLA-4 population in the lungs. (D) Flow cytometry of PD-1, TIGIT, and CTLA-4, expressed as percentage of tumour-infiltrating CD8+ T cells in the lungs. Values are means ± SEM; n = 10 mice/group; *p < 0.05, **p < 0.01, ***p < 0.001 (unpaired t-tests).

