
Fig. 2.
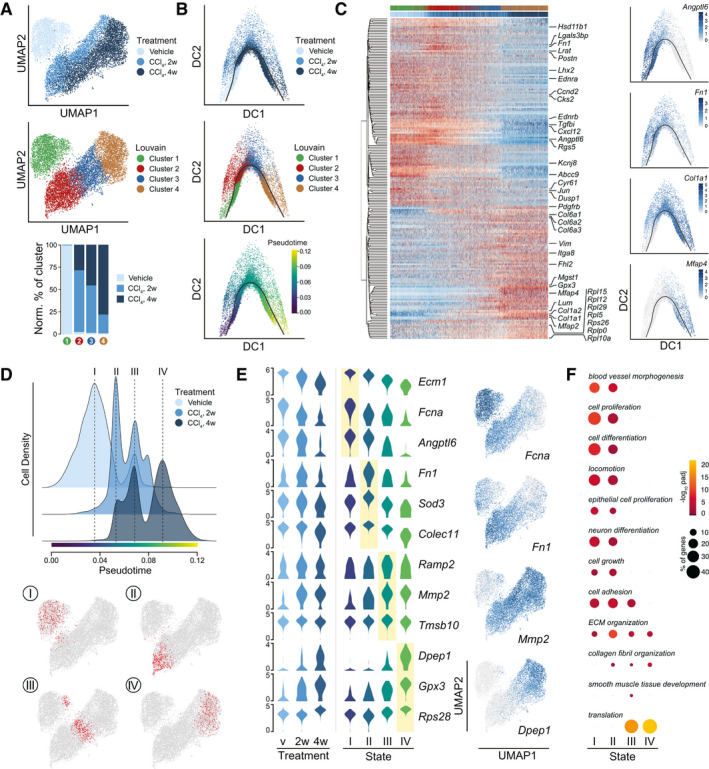
Hepatic stellate cell dynamics and functionality in healthy and fibrotic livers. (A) UMAPs of 10582 HSCs with indication of treatment groups and louvain clustering. Lower panel shows the representation of each treatment group in the louvain clusters 1‐4. Counts normalized by total HSC counts in each treatment group. (B) Diffusion maps of HSCs colored by treatment group, louvain clustering, and pseudotime. Black curve indicates the single‐lineage HSC activation trajectory. (C) Scaled, log2‐expression of top‐200 highly variable genes in HSCs over pseudotime. Select genes are highlighted and louvain cluster and treatment group of each cell are indicated. Right; diffusion maps showing log2‐expression of characteristic genes. (D) Cellular densities of HSCs along pseudotime with indication of four discrete, high‐density states I‐IV. HSCs are stratified by treatment group. Bottom; UMAPs highlighting the 500 HSCs around each density maximum. (E) Log2‐expression of top, unique signature genes of each state shown in all HSCs stratified by treatment group (left) and in the 500 HSCs around the density maximum of each HSC state (middle). Right: UMAPs of HSCs showing log2‐expression levels of select signature genes. (F) Enriched (Padj < 0.05) GO‐categories associated with each HSC state. Colors indicate significance of enrichment and circle sizes indicate number of genes falling into respective categories.