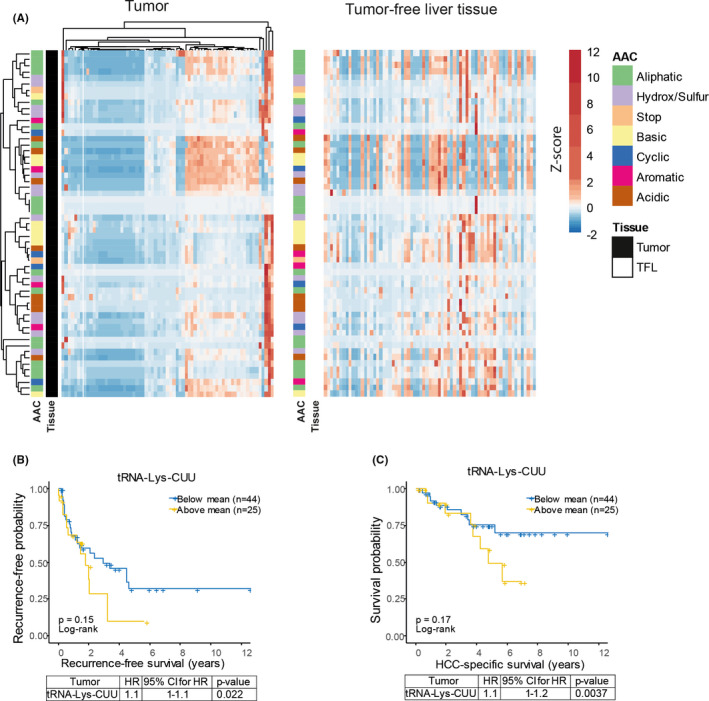
Figure 1.

Profiling tRNAome in HCC patients identified tRNA‐Lys‐CUU having potential clinical significance. (A) Heatmap showing the mean expression (z‐score normalized per tRNA species, represented in colour, as indicated in the legend) of 57 tRNA in tumour and TFL tissues respectively. Both rows (tRNA) and columns (patient samples) of tRNAs expressed in tumours (left panel) are hierarchically clustered using correlation distance and complete linkage. Rows and columns of tRNAs expressed in TFL (right panel) were ordered according to the rows and columns in the tumour heatmap. (B and C) Kaplan‐Meier analysis and Cox regression analysis of tumour recurrence (B) and HCC‐specific survival (C) in relation to tRNA‐Lys‐CUU expression. The panels below the survival graphs show the results of univariate Cox regression analysis. HR, Hazard Ratio; AAC, amino acid class; HCC, hepatocellular carcinoma; TFL, tumour free liver; CI, confidence interval
