
Figure 2.
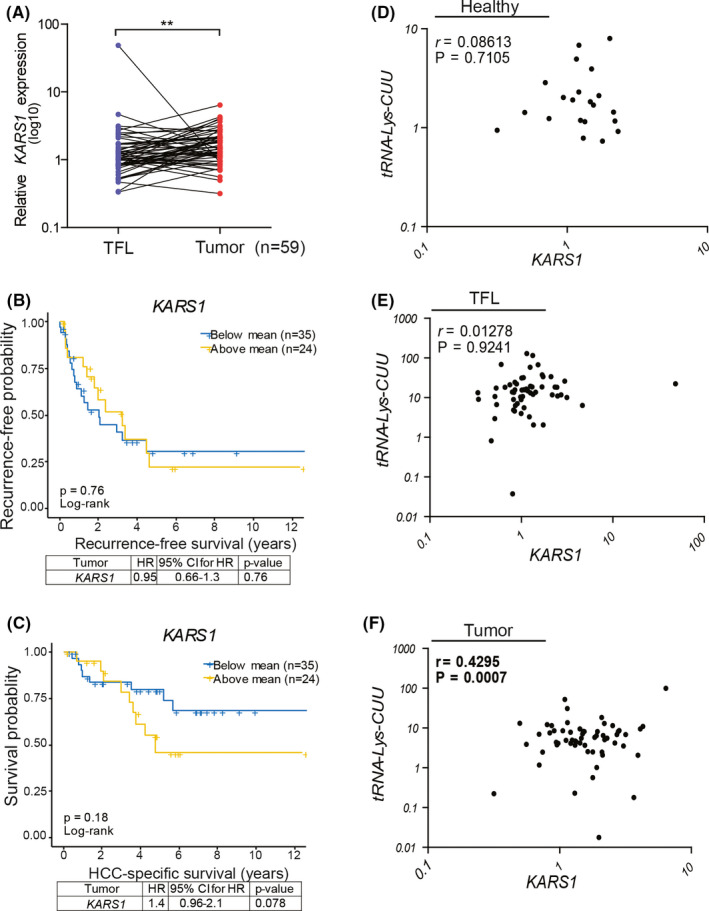
KARS1 expression and clinical relevance in HCC patients. (A) mRNA expression of KARS1 in HCC tumours compared to paired TFL tissues (n = 59). (B and C) Kaplan‐Meier analysis of tumour recurrence (B) and HCC‐specific survival (C) in relation to KARS1 expression in tumours. The panels below the survival graphs show the results of univariate Cox regression analysis. (D‐F) Correlation analysis between the expression levels of tRNA‐Lys‐CUU and KARS1 in healthy organ donor liver tissues (D, n = 21), TFL (E) and paired HCC tissues (F, n = 59) respectively. **P < .01, by the Wilcoxon matched pairs test. KARS1, Lysyl‐tRNA Synthetase; HCC, hepatocellular carcinoma; TFL, tumour free liver; HR, Hazard Ratio; CI, confidence interval